Lunar Gravity Field: GRGM1200A
Erwan Mazarico

Of all these bodies, the Moon now has the best-known gravity
field, thanks to the Gravity Recovery and Interior Laboratory (GRAIL) mission,
the first dedicated gravity planetary mission.
Because of the tidal lock of the Moon, it is not possible to directly track spacecraft over the lunar farside, which hampered earlier studies. The use of two spacecraft, which closely follow and track each other, enabled excellent, global spatial coverage. The lack of atmosphere also allowed the twin GRAIL spacecraft to fly at very low altitudes and be sensitive to very small mass anomalies and features.
The goal of the GRAIL mission was to obtain a map of the lunar gravity field with a resolution of 30 kilometers, equivalent to degree and order 180 in spherical harmonics (the typical basis functions used for gravity studies). The quality of the KBRR measurements (~30nm/s over 5 seconds) and the mission extension for 3 months at low altitude made it possible to achieve significantly better results.
Our latest model, GRGM1200A, is to degree and order 1200, with sensitivity down to <5 km resolution. Along with the previous lower-degree solutions (GRGM600PRIM1 and GRGM900C2), the GRGM1200A gravity coefficients and associated products are archived at the PDS Geosciences node. Here, we introduce in more detail these products.
Coefficients
The spherical harmonics coefficients are available in a simple ASCII column-separated format (SHA), and provide both the coefficient values and calibrated uncertainties. The calibration of GRGM1200A was performed similarly to GRGM900C2, and ensures these uncertainties are not overly optimistic. Important information can be found in the supporting label file (LBL), as well as a description of the SHA format.
Covariance Matrix
To understand and account for the errors and correlations between coefficients, the best method is to use the covariance matrix. The full covariance matrix for a degree and order 1200 field is extremely large (8 TB) and was not archived. However, several truncated covariance matrix files are archived:
|
Truncation Degree |
File size |
||
|
50 |
26 MB |
LBL | |
|
180 |
4 GB |
||
|
420 |
117 GB |
||
|
660 |
711 GB |
||
|
900 |
2455 GB |
These products are only available in binary format, as SHB files. The format description is included in the supporting label LBL files.
Clone Fields
Because of their size, and because their use is not straightforward in many studies, ‘clone fields’ provide an attractive alternative.
These are produced from the full covariance matrix, and do account for the cross-correlations between all coefficients. As such, they are a great way to assess the sensitivity of any modeling or analysis to the gravity field errors. In most cases, running a model with multiple clone fields and evaluating the variance in results can establish how sensitive these results are to the current knowledge of lunar gravity.
Five hundred (500) clone fields of GRGM1200A are archived at PDS. A technical memorandum gives technical detail on their creation from the least-squares system.
GRGM1200A clones 001-100
GRGM1200A clones 101-200
GRGM1200A clones 201-300
GRGM1200A clones 301-400
GRGM1200A clones 401-500
Bouguer Field
Spacecraft are sensitive to the entire planetary gravity fields, also called "free-air". Through geophysical modeling, such gravity field measurements can be used to understand the subsurface structure and density of planetary bodies. A simple first step is to remove the effects of the know topographic relief on the measured gravity, in order to highlight the contributions from subsurface mass anomalies. Assuming a constant crustal density, the gravity field induced by the topography, called Bouguer correction, can be computed3.It is important to note that given GRAIL's high precision and resolution, the topography needs to be expressed in the same reference frame as the GRAIL gravity solutions, namely the Principal Axes frame (MOON_PA) as opposed to the Mean Earth (MOON_ME) frame used for most cartographic uses. The LOLA team archived a spherical harmonics expansion of the lunar topograhy in the MOON_PA frame specifically for this reason (SHA, LBL).
Subtracting that correction from the free-air gravity yields the Bouguer gravity field. As shown below, subsurface features and crustal thickness variations then appear clearly. The spherical harmonics coefficients of the Bouguer gravity can be used to perform geophysical spectral analysis, such as crustal thickness modeling. These coefficients are archived in the SHA format, with a supporting description (LBL).
Spatial Expansions (i.e., Maps)
Although the spherical harmonics coefficients and their covariance are very useful for geophysical analysis, other studies benefit from map products. The spherical harmonics can be expanded into maps of arbitrary resolutions, although they of course only contain signal down to the resolution corresponding to their truncation degree).
The following map products are made available, both in the standard PDS IMG format and in a more user-friendly GeoTIFF format that can easily be imported into GIS software (QGIS, ArcMap, etc.).
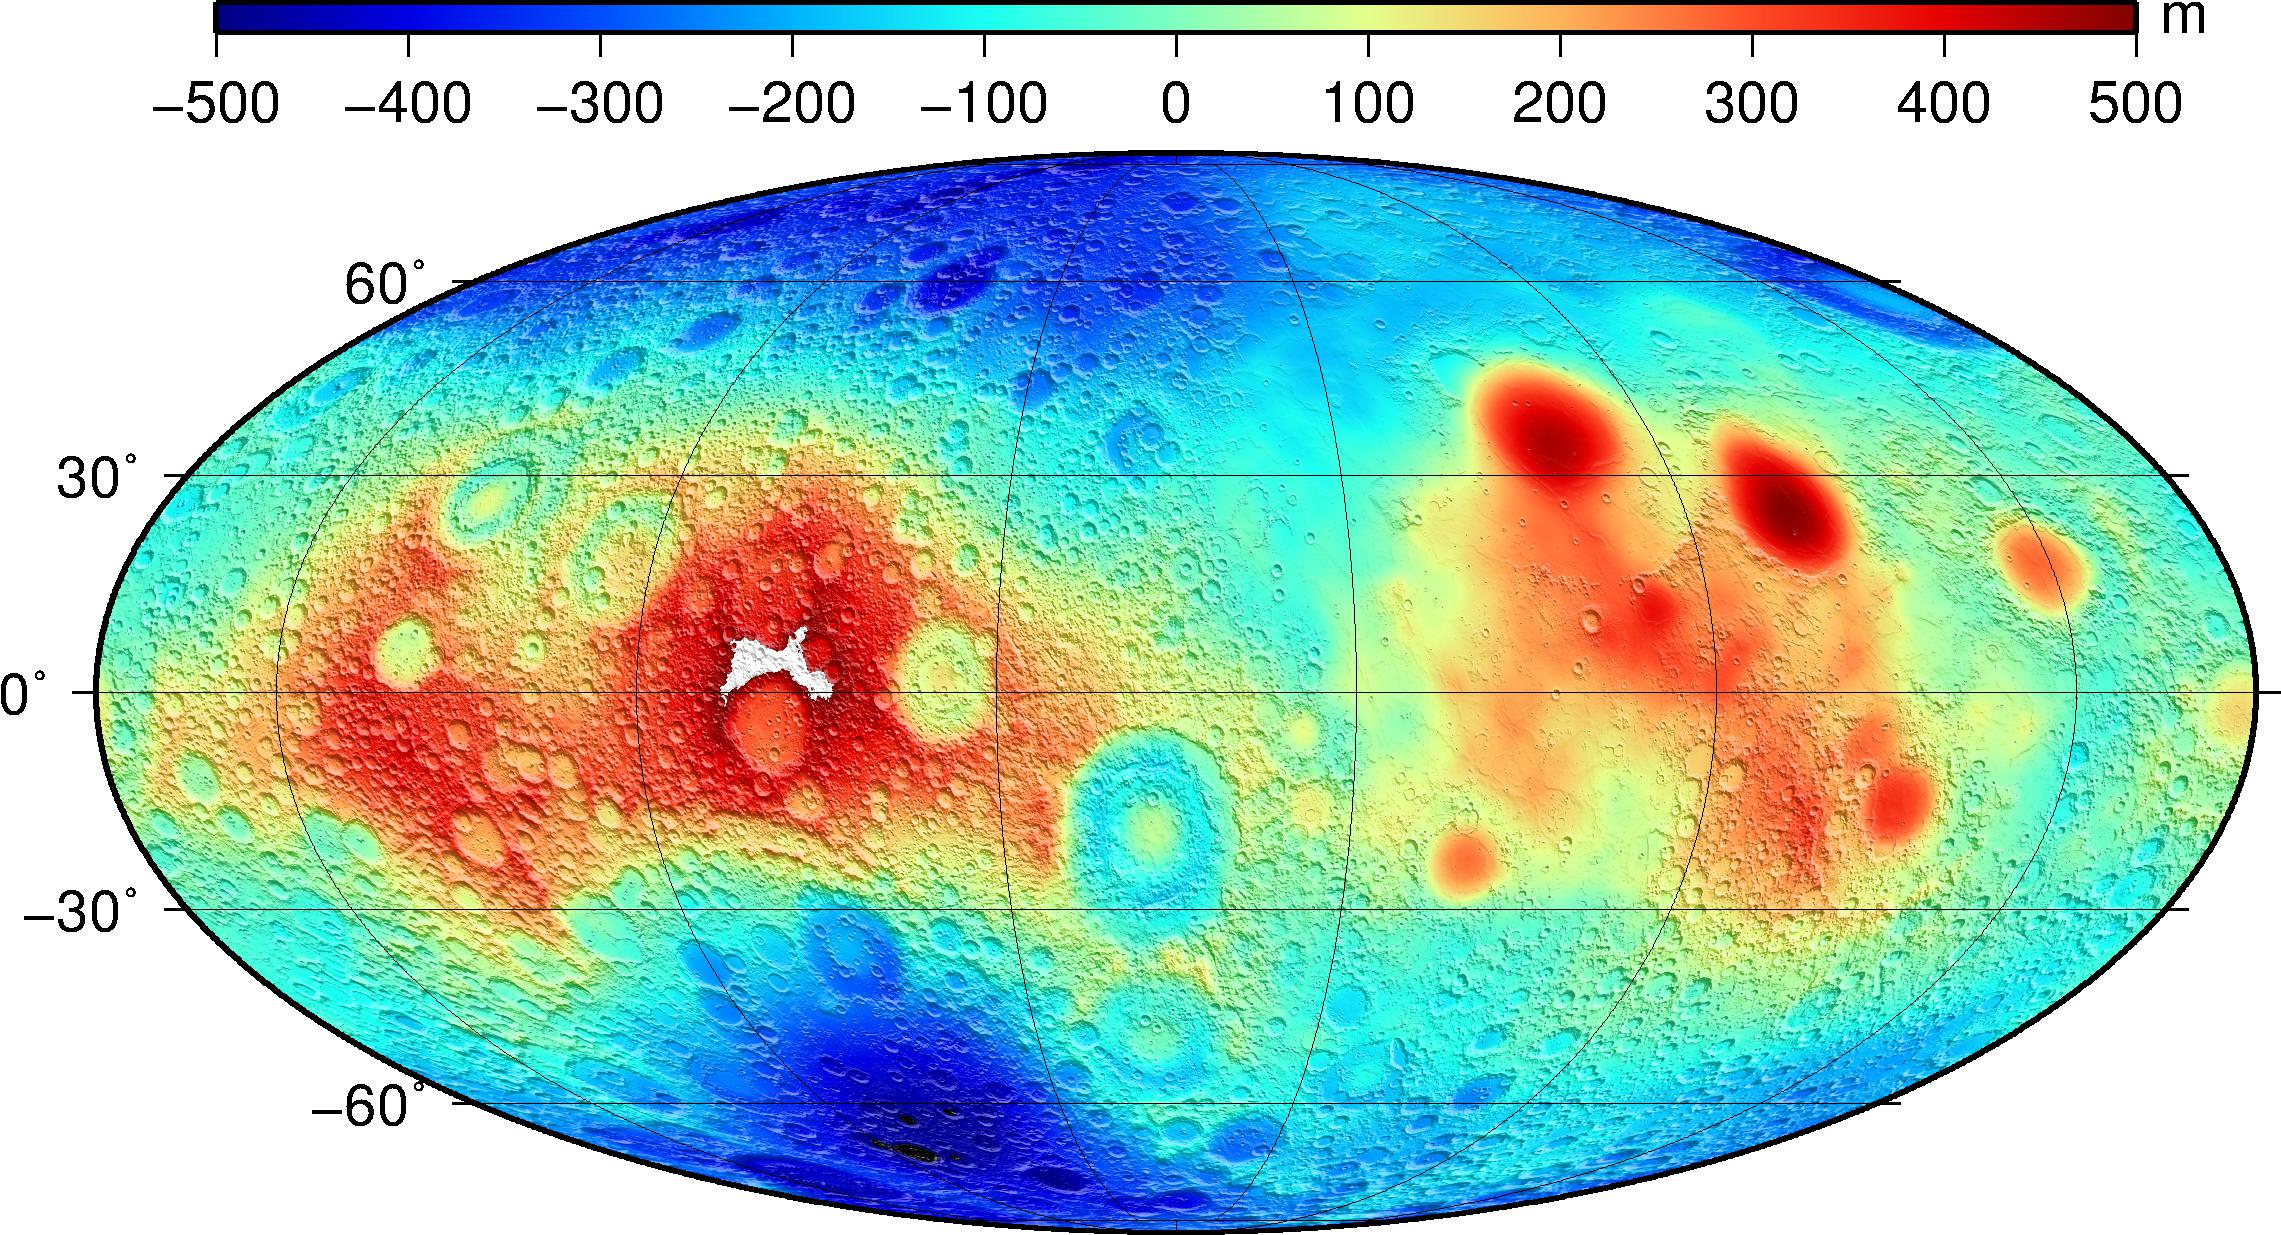
- Gravity Disturbance
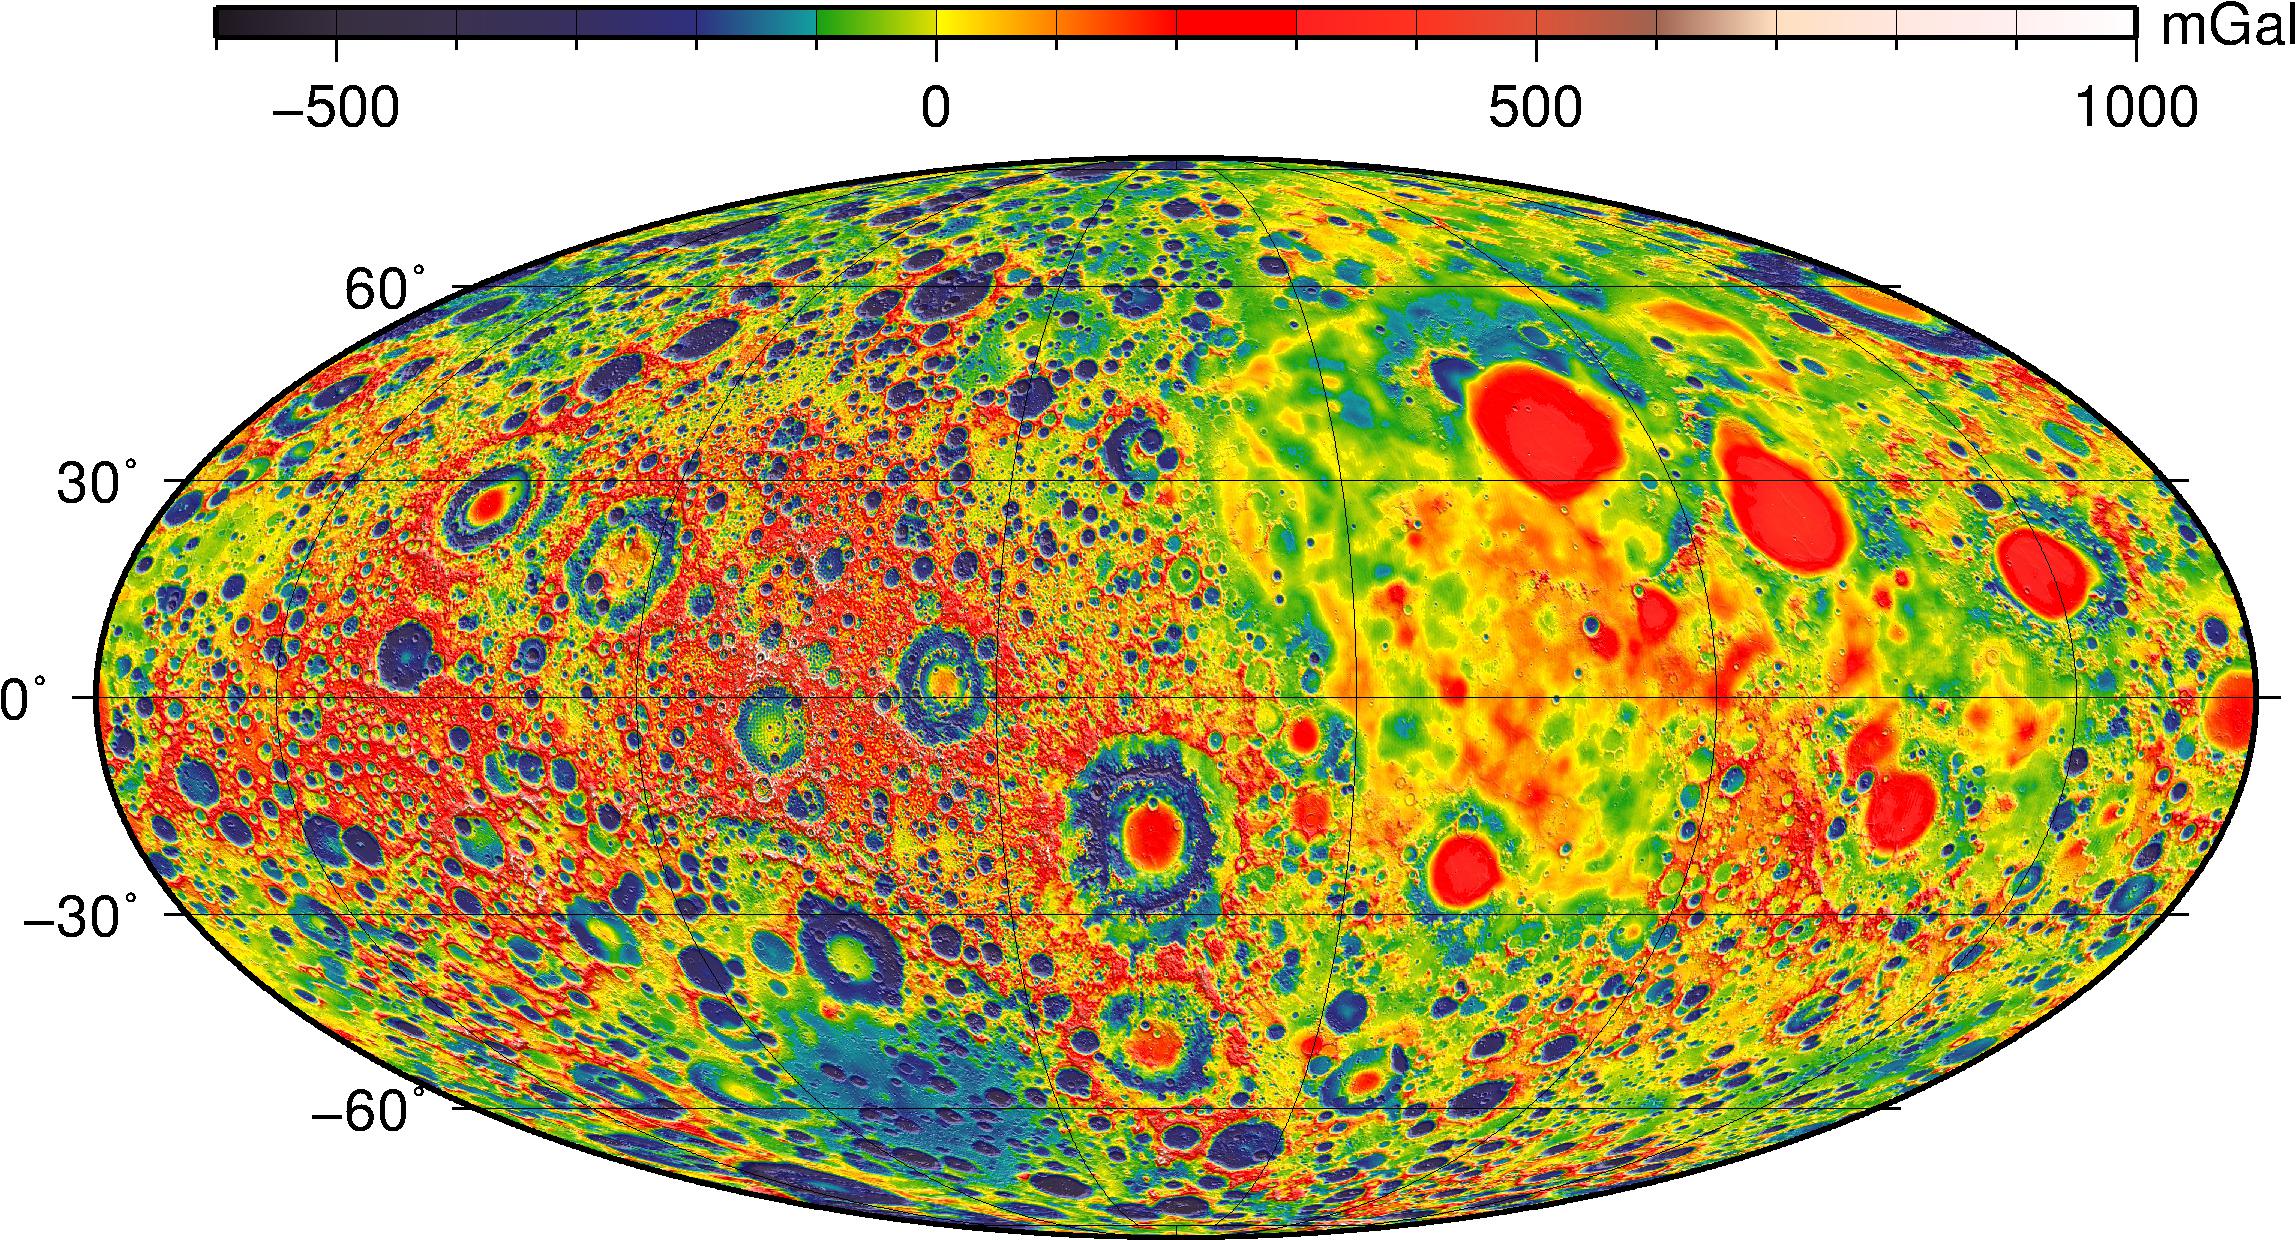 The gravity disturbances, ??V(r,?,?,)/?r, are the gravity perturbations
computed at the reference radius of 1738 km. They show the "free-air"
variations as measured by the spacecraft, and thus include contributions
from both the surface relief and any sub-surface interface (such as the
crust-mantle boundary, or Moho).
The gravity disturbances, ??V(r,?,?,)/?r, are the gravity perturbations
computed at the reference radius of 1738 km. They show the "free-air"
variations as measured by the spacecraft, and thus include contributions
from both the surface relief and any sub-surface interface (such as the
crust-mantle boundary, or Moho).
| Expansion Degree for maps of Gravity Disturbance | IMG | LBL | GeoTIFF |
| L=50 | x | x | x |
| L=180 | x | x | x |
| L=420 | x | x | x |
| L=660 | x | x | x |
| L=900 | x | x | x |
| L=1200 | x | x | x |
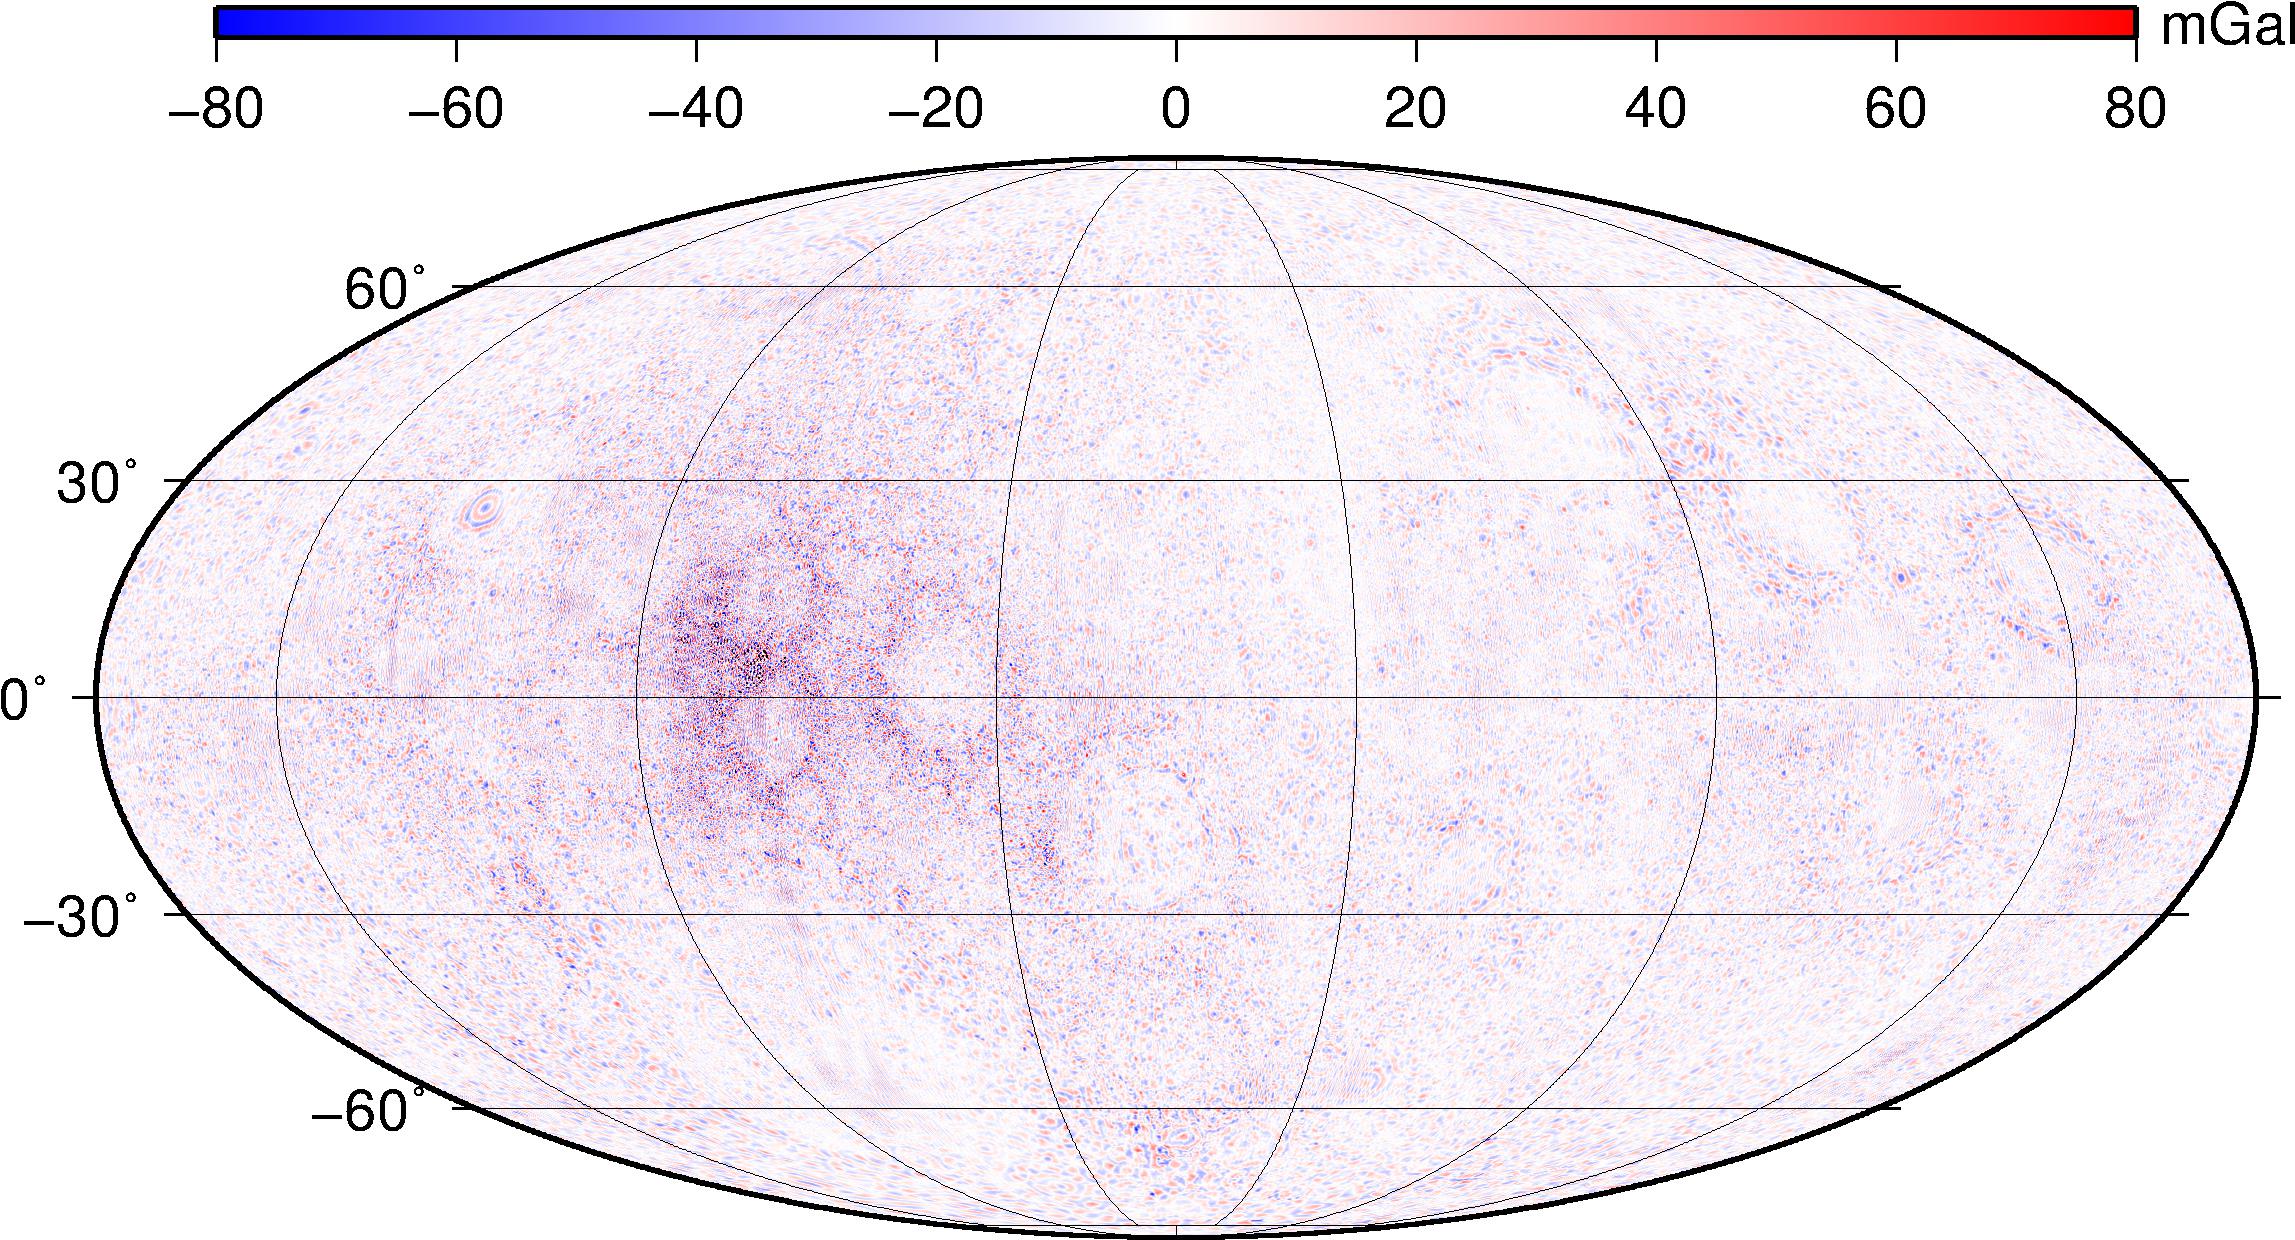
- Bouguer Gravity Disturbance
As explained above, Bouguer gravity removes from the free-air gravity the signal expected purely from surface relief, assuming a (constant) crustal density. Over the whole spectrum, the Bouguer map is dominated by the crustal thickness dichotomy between nearside and farside, and the South Pole-Aitken basin is also prominent. It also helps to identify burried, interior mass anomalies, such as those created by large impact craters. Filtering out the longest wavelengths from the Bouguer map highlights the lunar mascons, prominent on the nearside but also present in the lunar highlands of the farside.
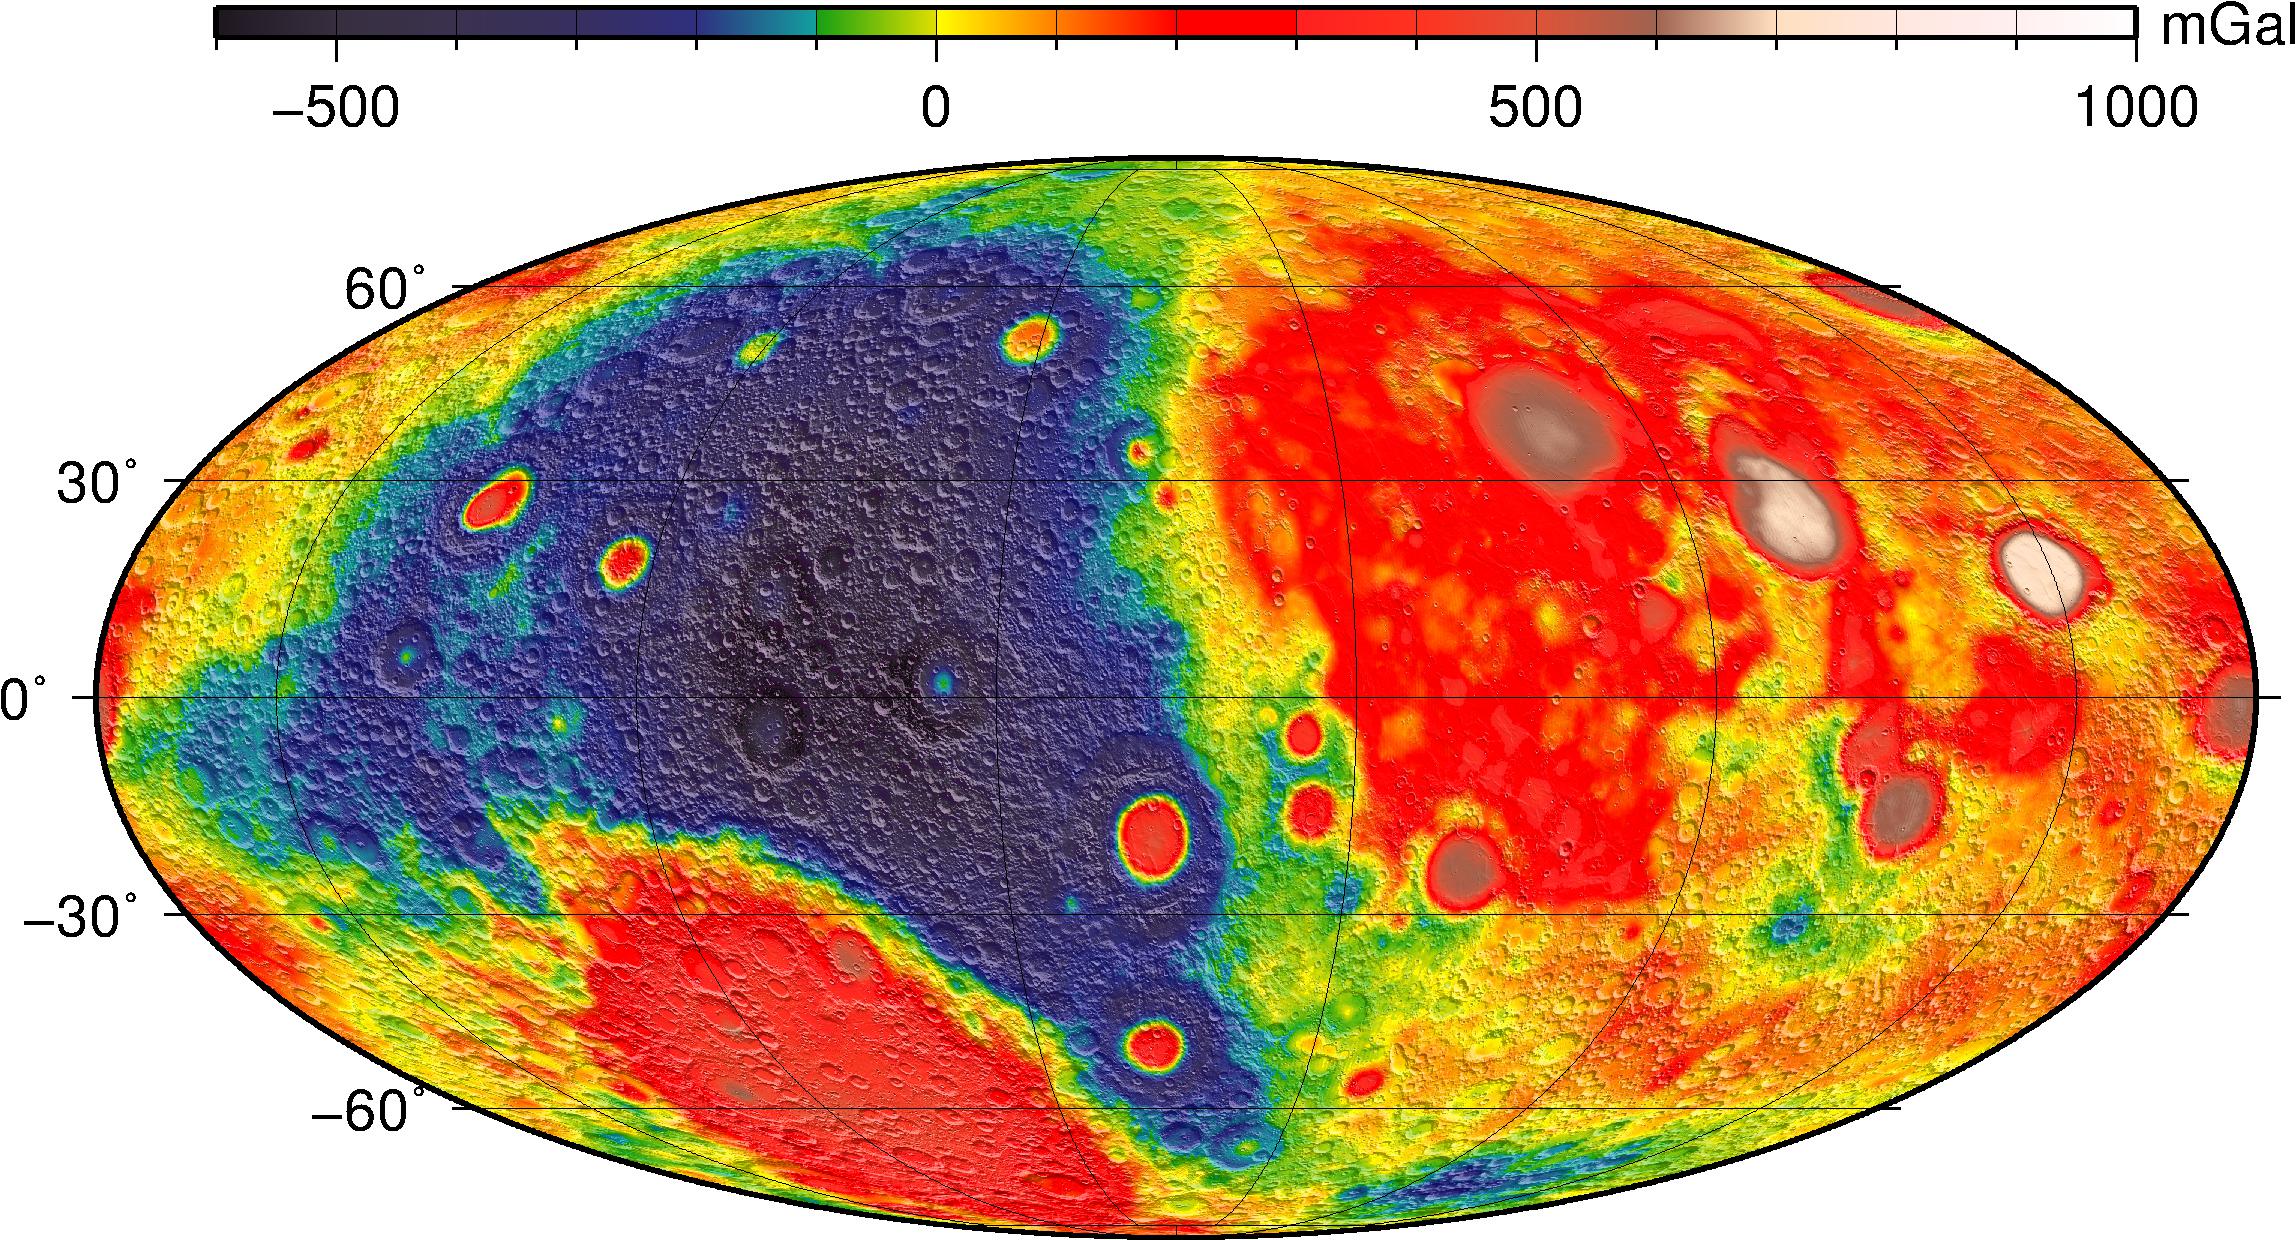
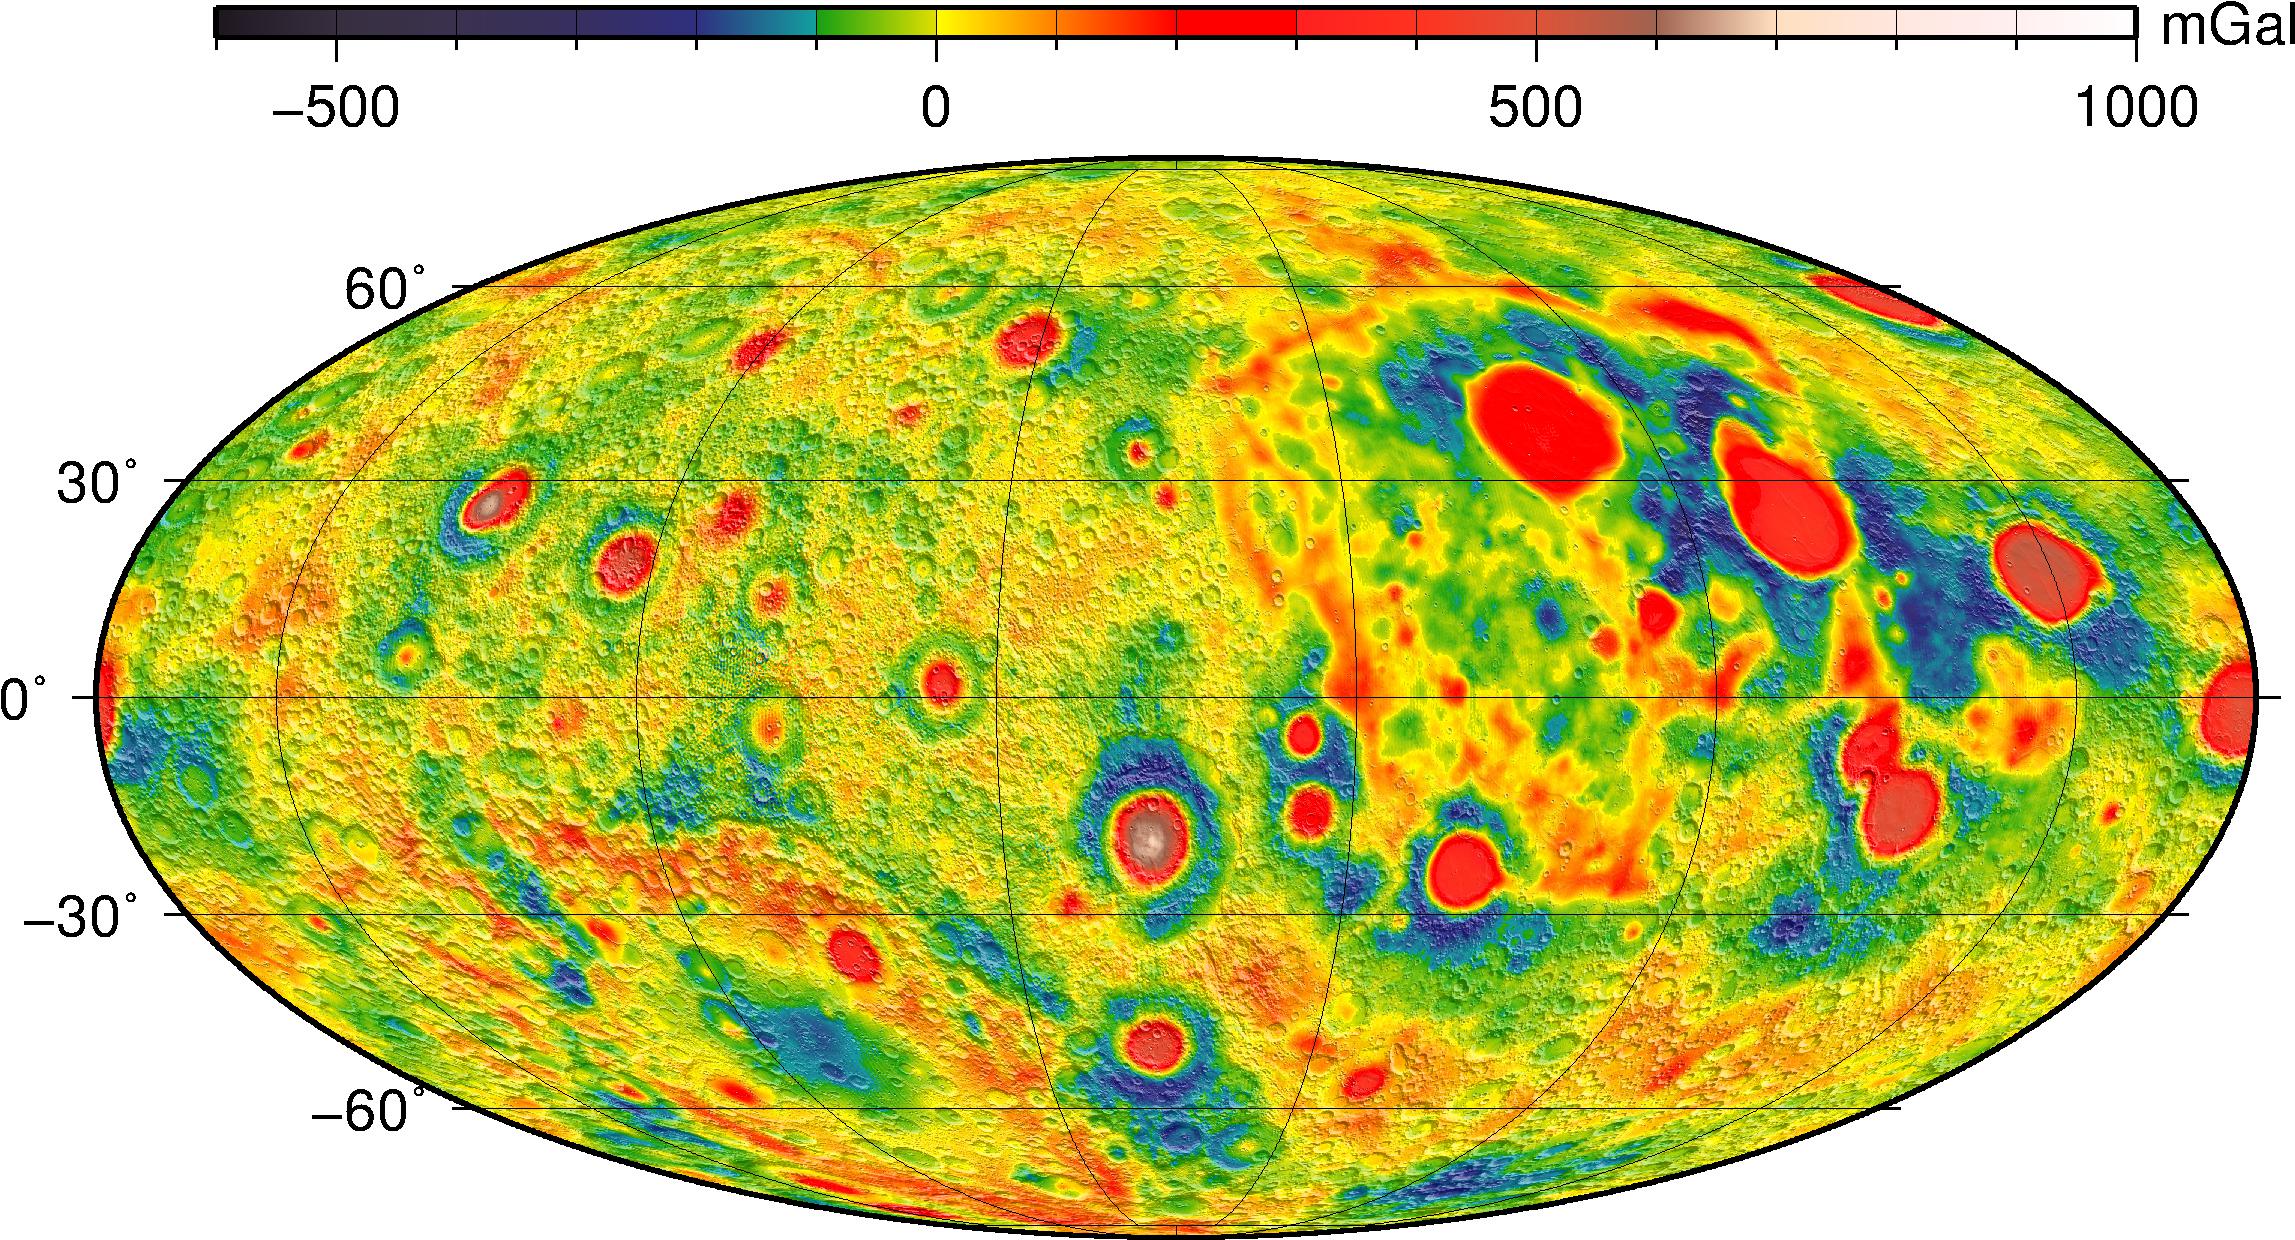
Left: the full Bouguer map (l=1-700) is dominated by the crustal thickness
dichotomy between nearside and farside, and the South Pole-Aitken basin. Right: a filtered Bouguer map (l=7-700) highlights the lunar mascons.
| Expansion Degree for maps of Bouguer Gravity Disturbance | IMG | LBL | GeoTIFF |
| L=50 | x | x | x |
| L=180 | x | x | x |
| L=420 | x | x | x |
| L=660 | x | x | x |
| L=900 | x | x | x |
| L=1200 | x | x | x |
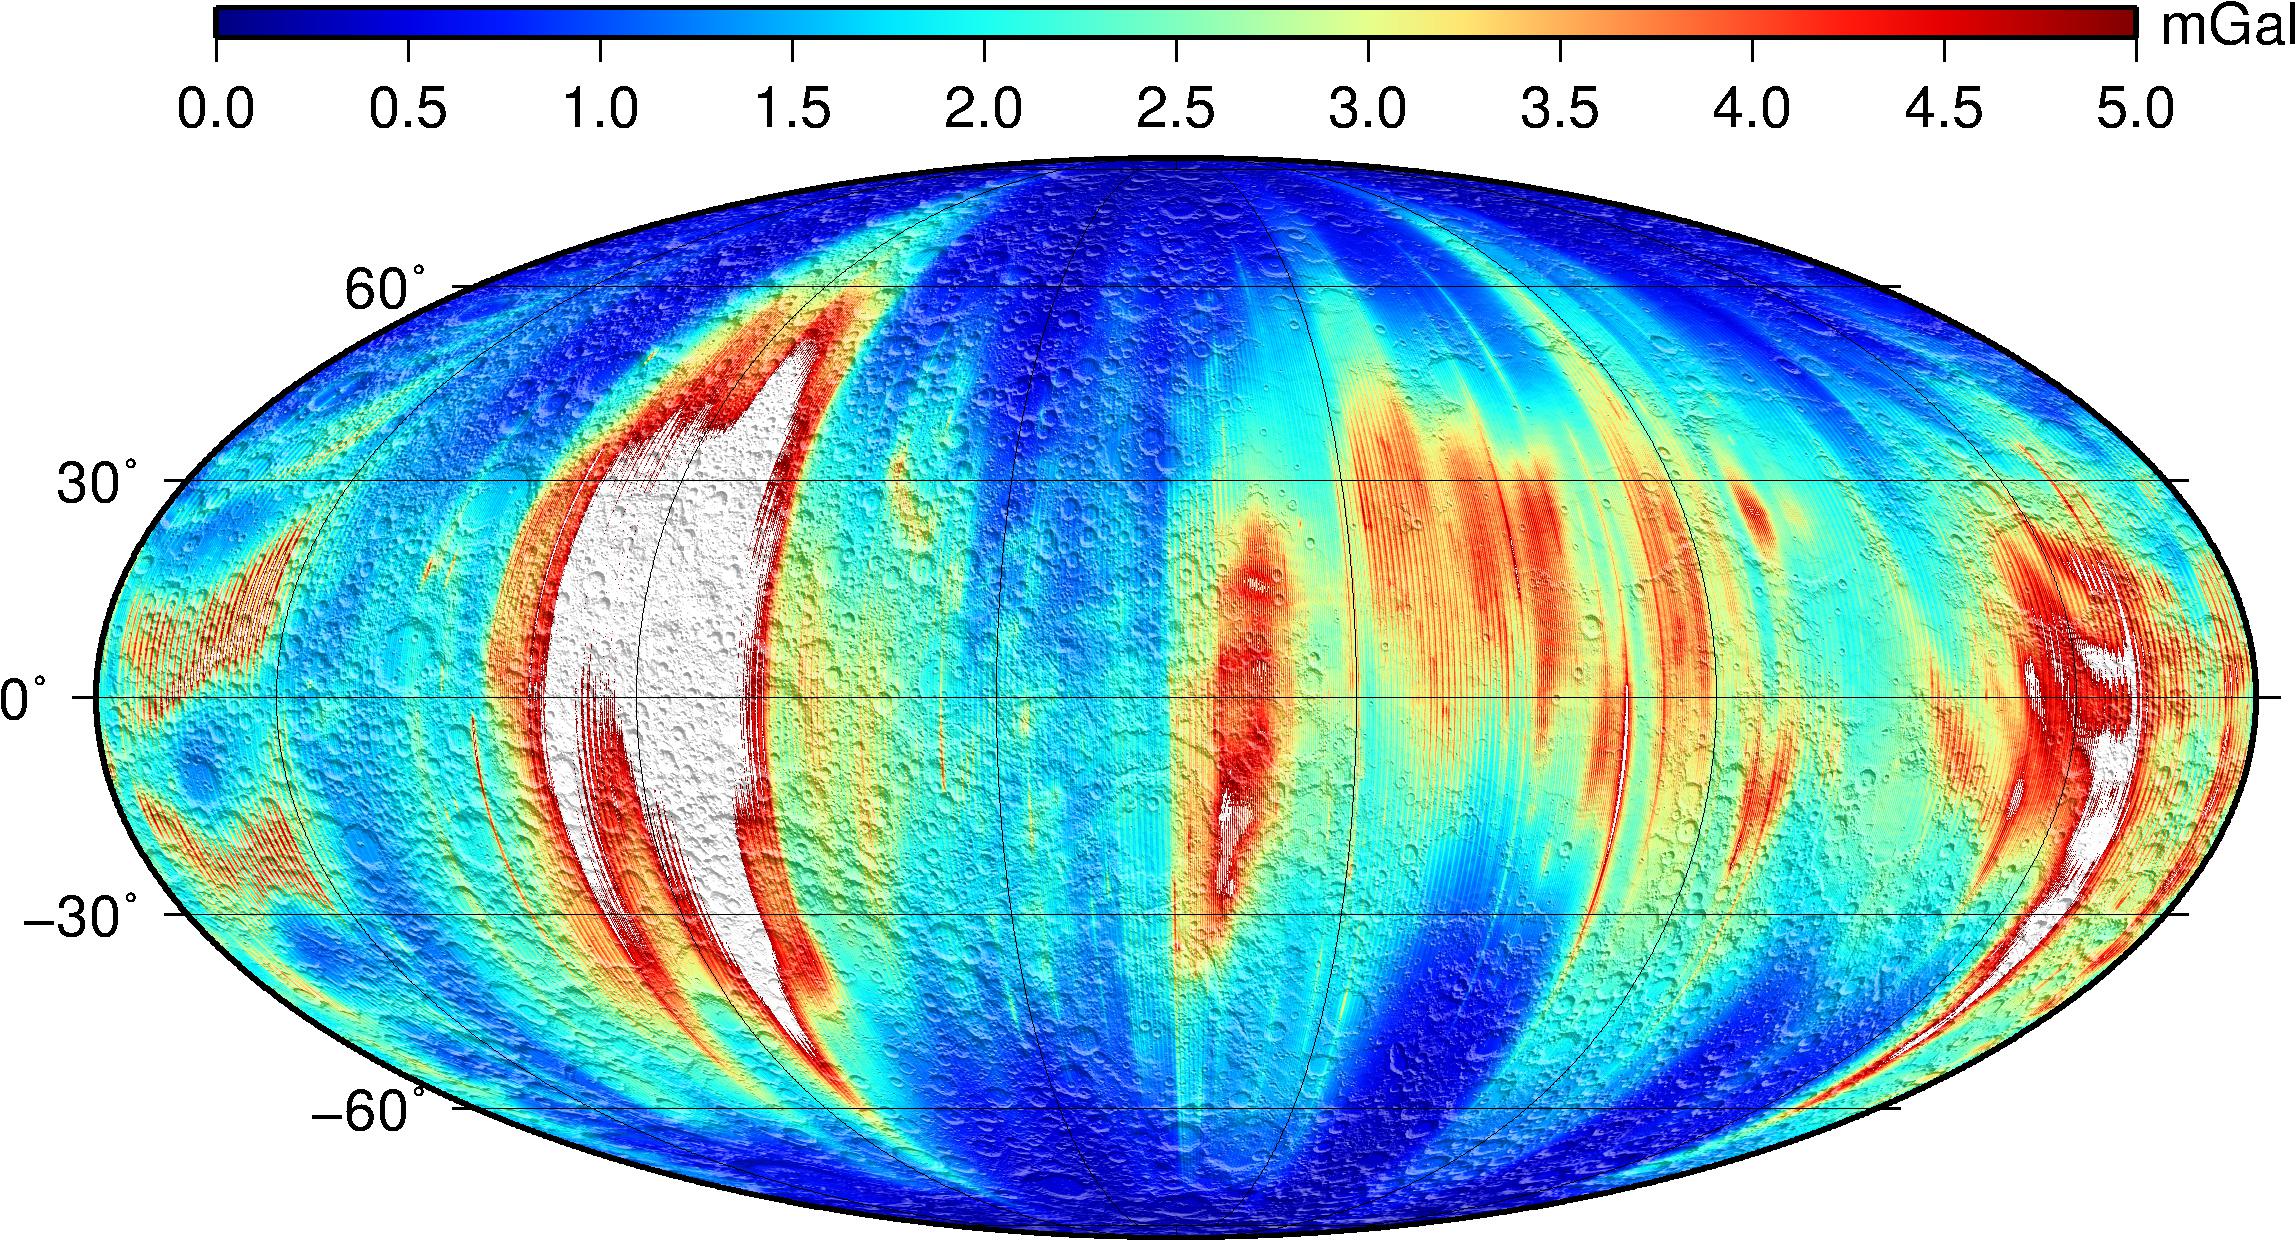
- Anomaly Error
Gravity anomaly errors can be directly computed from the covariance matrix, but that can be prohibitive with such large expansions as those obtained from GRAIL data. Rather, we use clone fields to approximate the variance in gravity anomalies at the surface (again, see the technical memorandum on clone fields). We used 1,000 clone fields to obtain maps of the errors in GRGM1200A when expanded to various truncation degrees (50, 180, 420, 660, 900, and the full 1200).
| Expansion Degree for maps of Gravity Anomaly Error | IMG | LBL | GeoTIFF |
| L=50 | x | x | x |
| L=180 | x | x | x |
| L=420 | x | x | x |
| L=660 | x | x | x |
| L=900 | x | x | x |
| L=1200 | x | x | x |
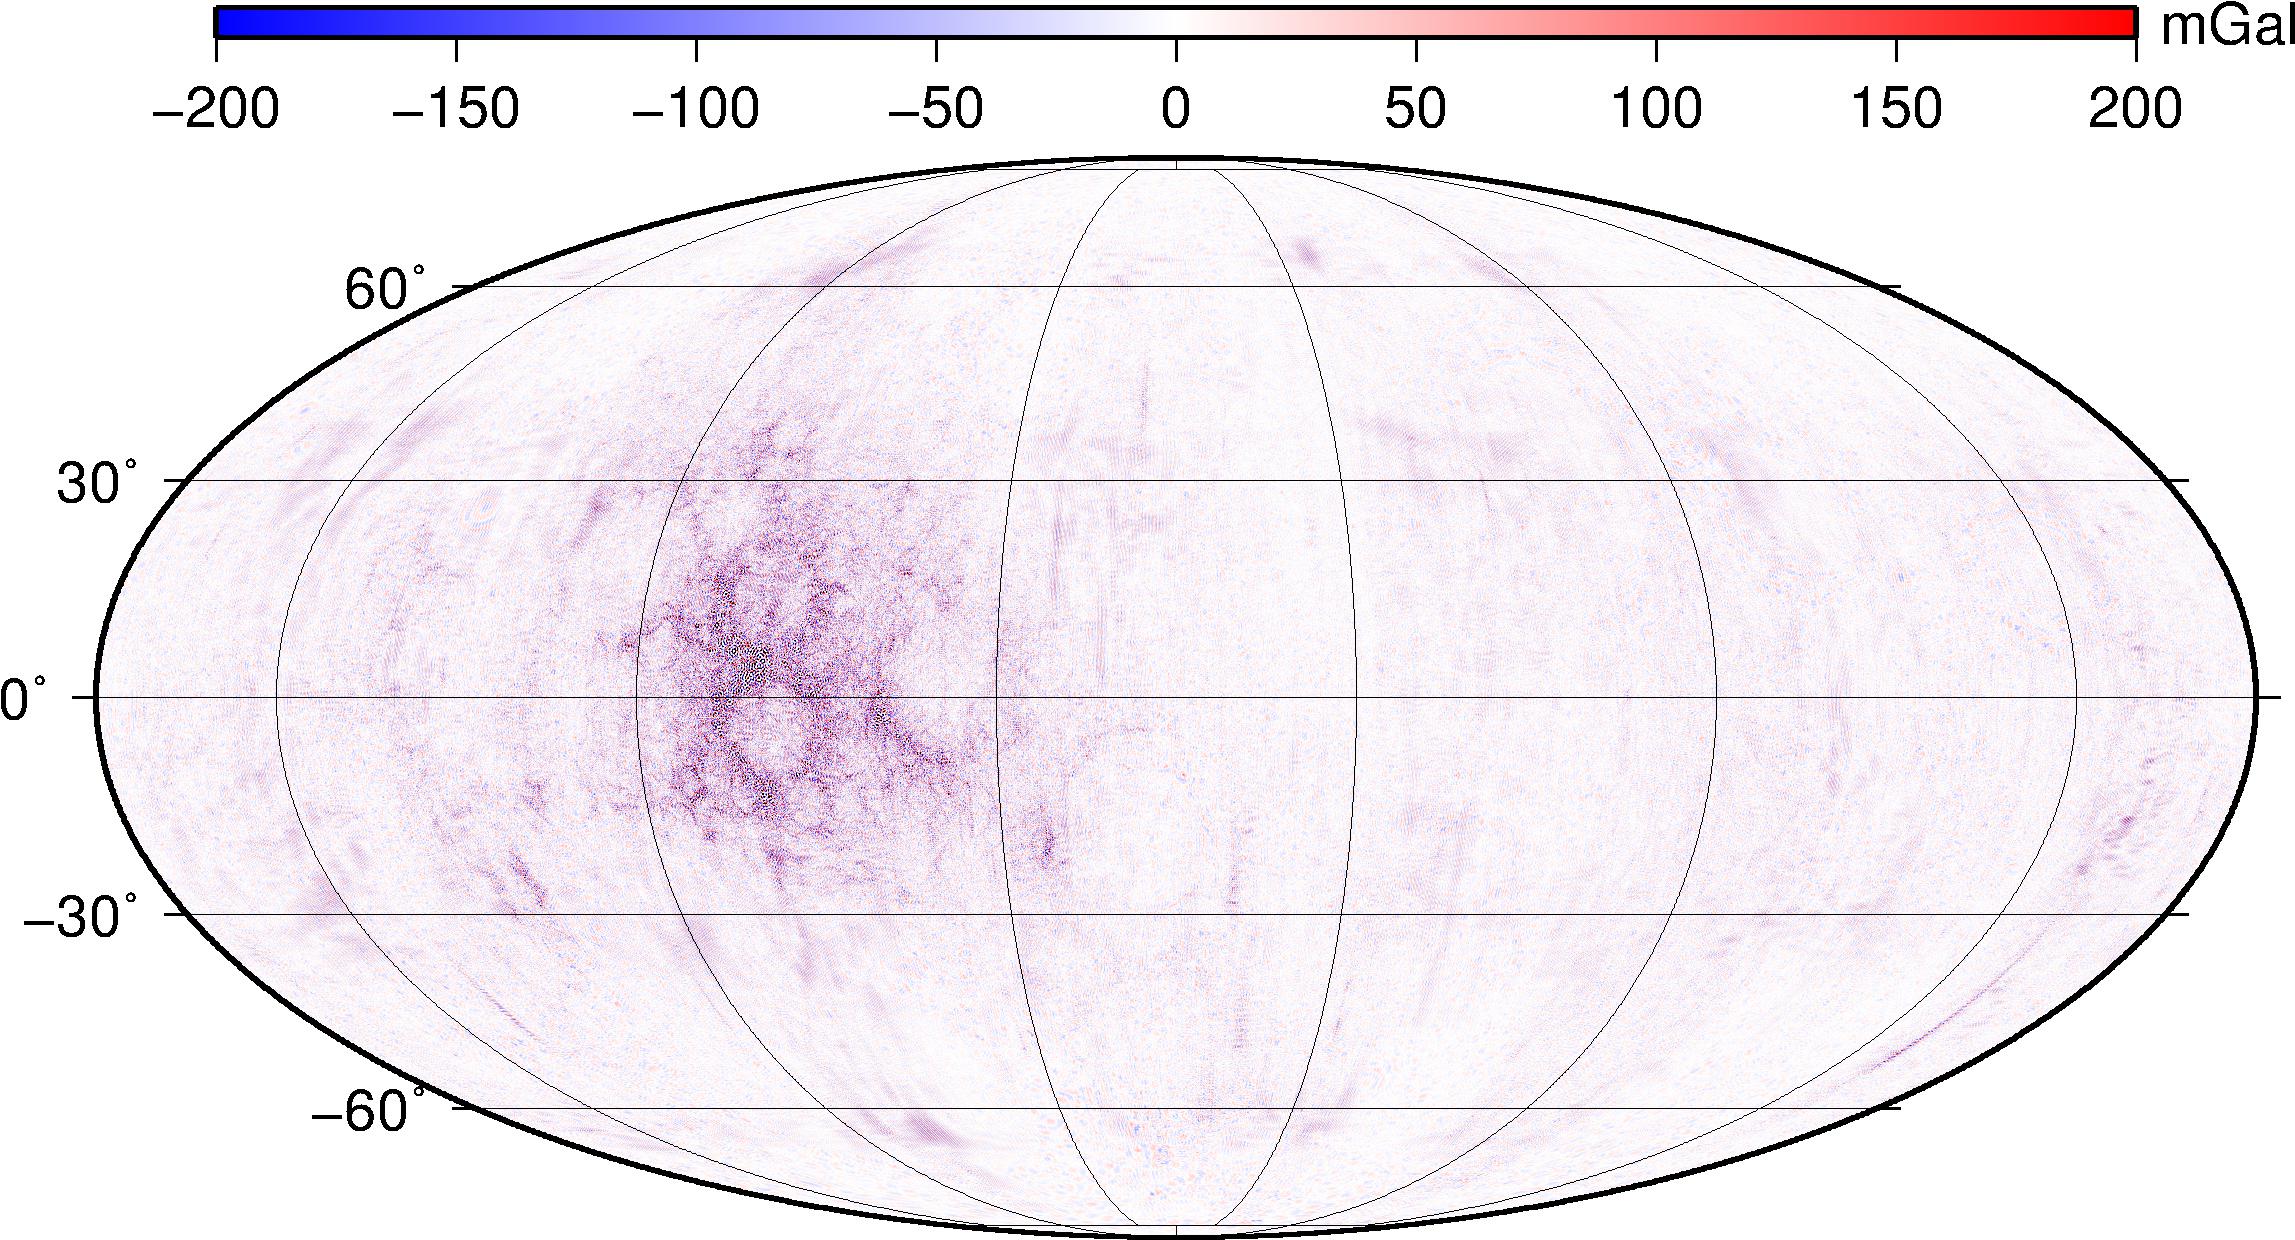
Left: Bouguer gravity anomalies filtered between L=150 and L=720. Right: idem, but to degree and order 900.
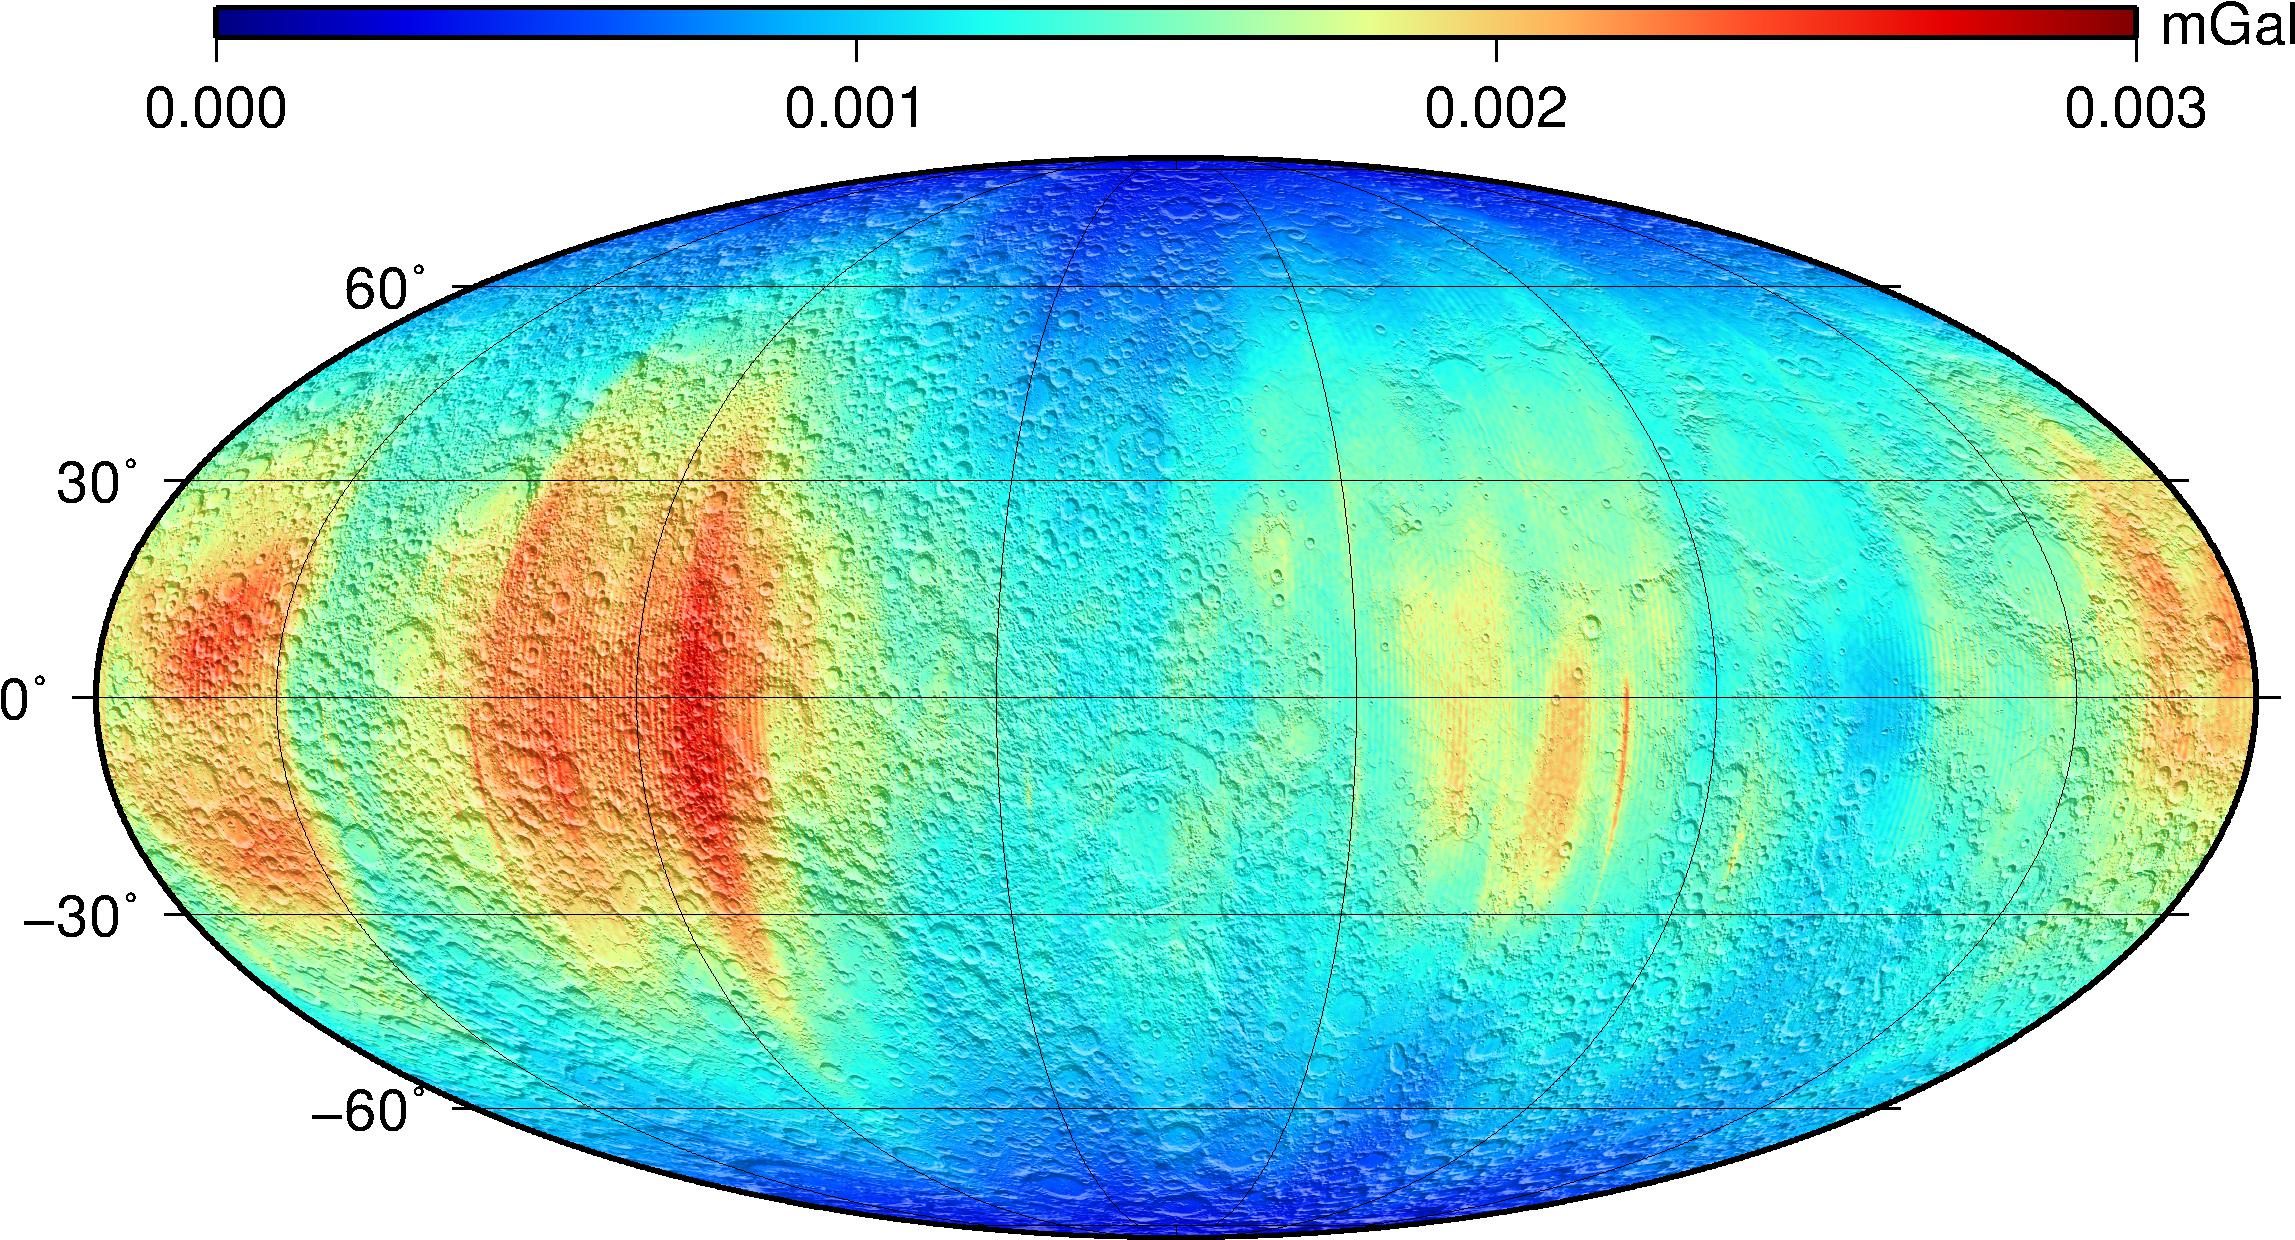
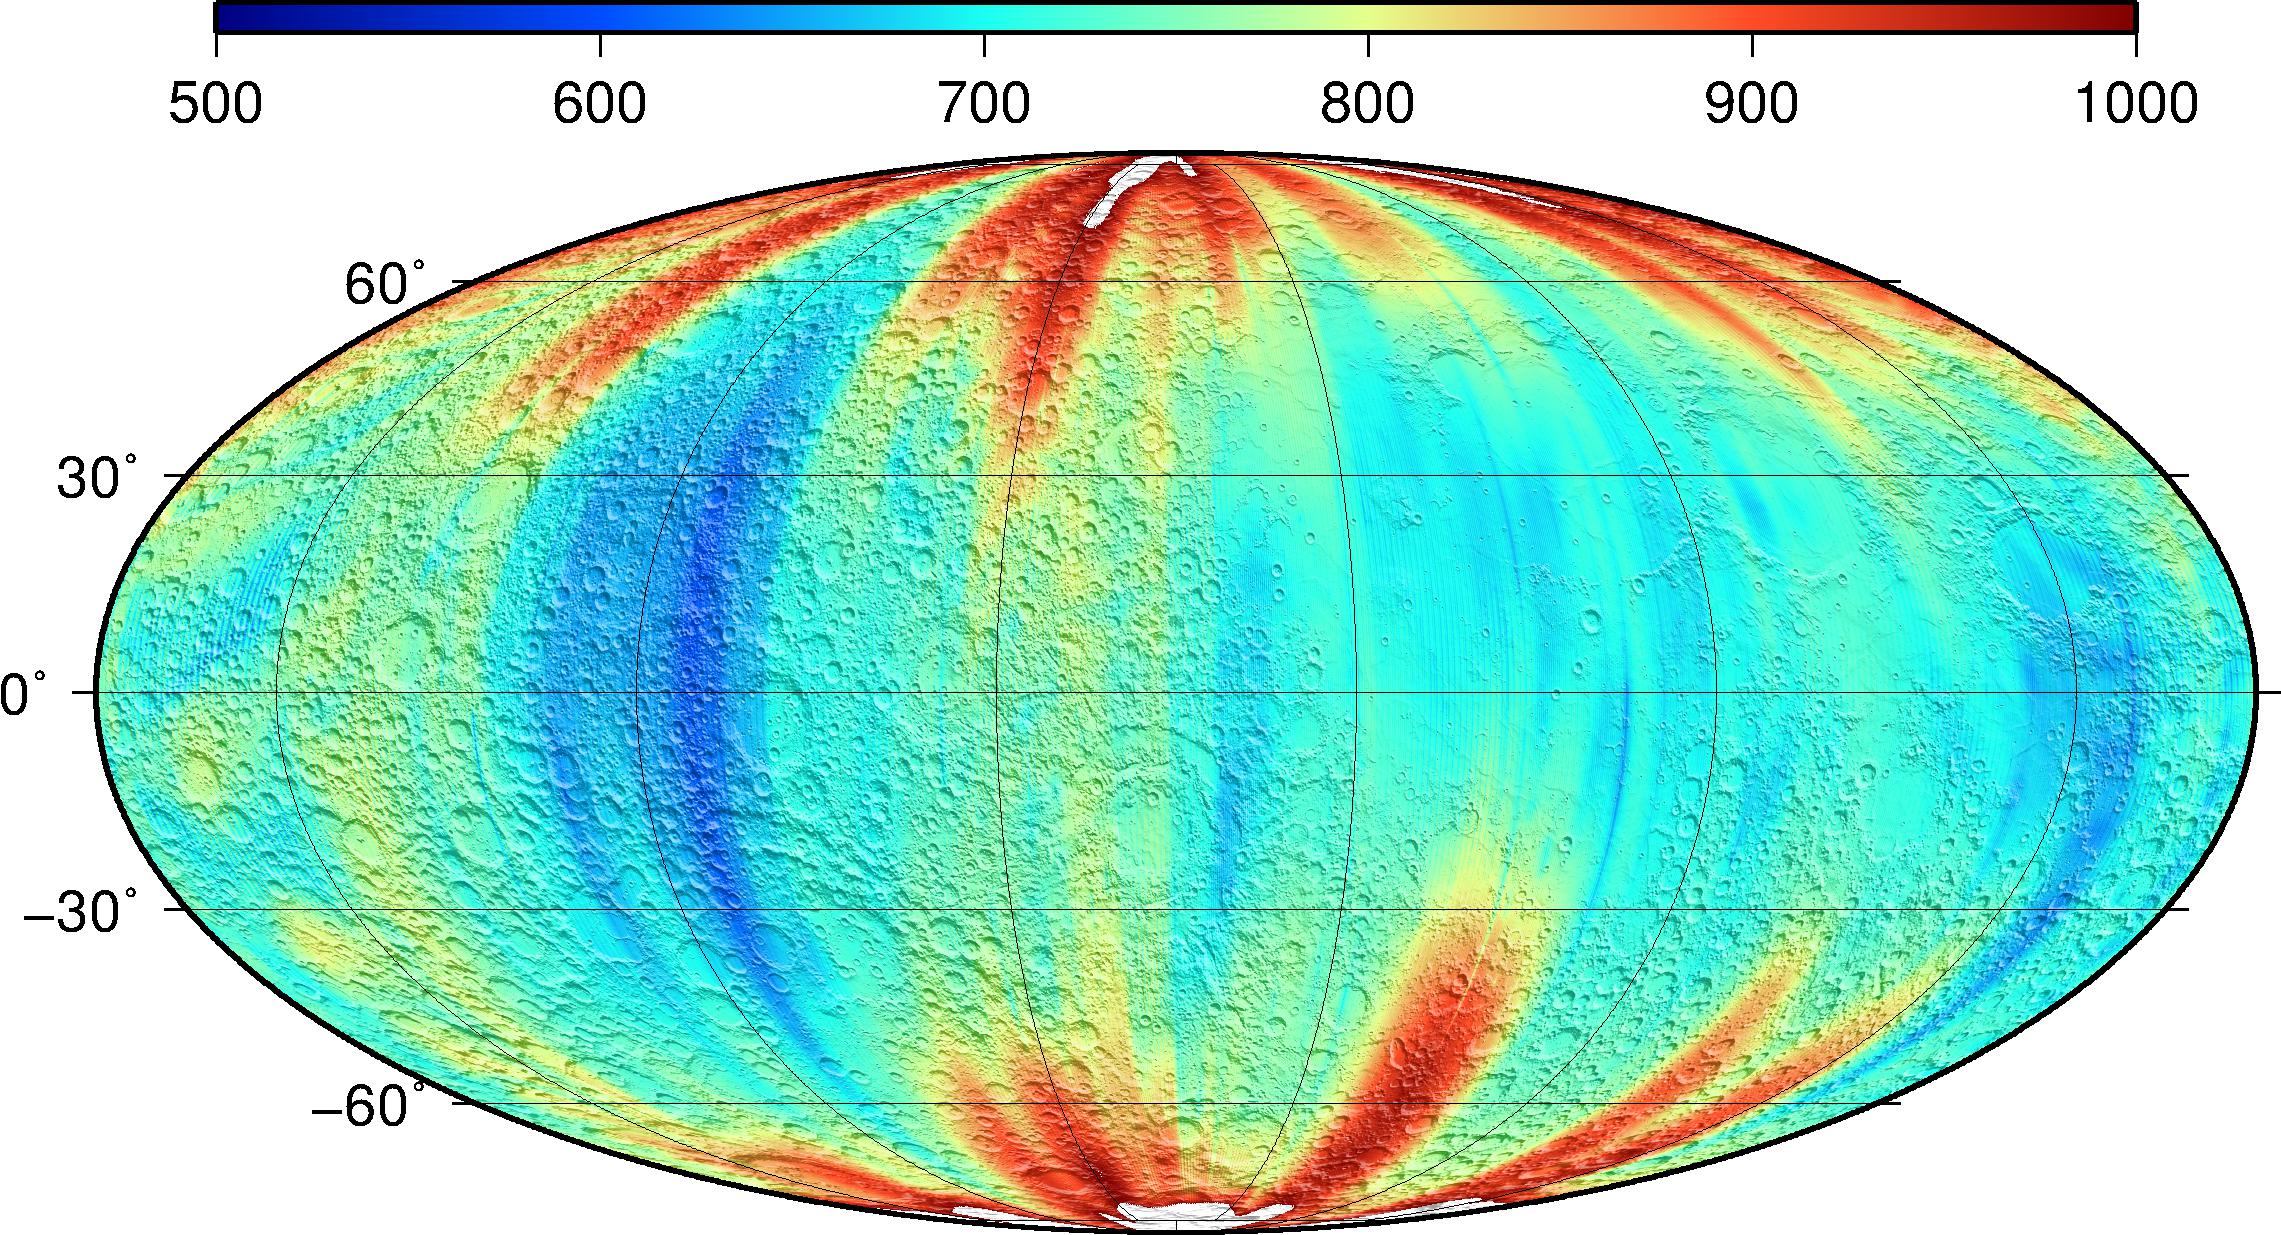
- Degree Strength
Another useful quantity to assess field quality is the degree strength, so-called because it reflects the spherical harmonics degree up to which the gravity signal is larger than the estimated uncertainty. Beyond that, noise dominates and the coefficients are not likely to be known individually, and to sufficient precision for performing spectral analysis. The degree strength concept was first used during analysis of Magellan data around Venus4. A series of anomaly error maps computed to different truncation degrees were compared to the power of the Kaula constraint at these degrees, so that a degree strength value could be obtained at each location on the Moon. The result is shown below, and is available as a PDS IMG with label (LBL), and as a GeoTIFF.
- Geoid
Finally, the geoid of the Moon can be computed from the GRGM1200A coefficients. While loosely called "topography", the LOLA data archived on PDS actually correspond to shape or elevation datasets. Topography is referenced to the geoid, so formally the lunar geoid should be subtracted from the lunar elevation maps. Although the geoid slopes are not as dramatic as on Mars, differences between shape slopes and topography slopes may be important in some locations, such as the boundaries of nearside mascons.
The GRGM1200A geoid, computed to degree and order 660, is available as a PDS IMG with label (LBL), and as a GeoTIFF.
Data Usage Policy
Lemoine, F. G., et al. (2014), GRGM900C: A degree 900 lunar gravity model from GRAIL primary and extended mission data, Geophys. Res. Lett., 41, 3382-3389, doi:10.1002/2014GL060027
Goossens, S., et al. (2016), A Global Degree and Order 1200 Model of the Lunar Gravity Field using GRAIL Mission Data, Lunar and Planetary Science Conference, Houston, TX, Abstract #1484. [PDF]
References
2 Lemoine, F. G., et al. (2014), GRGM900C: A degree 900 lunar gravity model from GRAIL primary and extended mission data, Geophys. Res. Lett., 41, 3382-3389, doi:10.1002/2014GL060027
3 Wieczorek, M. A., and R. J. Phillips (1998), Potential anomalies on a sphere: Applications to the thickness of the lunar crust, J. Geophys. Res., 103(E1), 1715–1724, doi:10.1029/97JE03136
4 Konopliv, A. S., et al. (1999), Venus Gravity: 180th Degree and Order Model, Icarus, 139(1), 3-18, doi:10.1006/icar.1999.6086