Permanent Shadow at Ceres
Erwan Mazarico
After exploring asteroid (4)
Vesta, the Dawn mission entered the orbit of dwarf planet (1) Ceres in March
2015. Ceres has been studied since its discovery in 1801 from ground-based and then space-based telescopes, and these
observations have constrained some of its orbital and physical properties. Its
orbit, size, and orientation were known to good accuracy compared to the vast
majority of main-belt asteroids. Though its craters were thought to have mostly
relaxed in the non-polar regions, the low obliquity value inferred from
ground-based observations left open the possibility of permanent shadow
existing in polar regions.
During its exploration of Ceres,
Dawn acquired imagery and radio tracking data that allowed much finer
measurements of these parameters. The pole orientation was significantly
revised, but implied a similar obliquity (~4°; although the season phasing was opposite
of anticipated). The many images returned from a variety of spacecraft position
and surface lighting conditions allowed the construction of shape models.
From that knowledge, it is
possible to numerically model the illumination conditions of Ceres’ surface.
Similarly to what was done at the Moon and Mercury, which have smaller
obliquities (1.54° and 0.03°,
respectively), maps of average solar illumination of the north polar region of
Ceres were obtained by computing the insolation over one Ceres rotation period
at northern solstice (which occurred in mid-2015, shortly after Dawn arrived at
Ceres). The quality of shape models in the south polar region is significantly
degraded because of the southern winter season and the ensuing seasonal shadows
over most of that region.
The permanently shadowed regions
of Ceres have been shown to be cold enough to host volatiles, which makes them
relevant to the delivery of volatiles in the Solar System, especially given the
fact that the PSRs on the Moon and Mercury cannot currently be understood
within a single framework.
 The publication by Schorghofer et al. (2016) in Geophysical Research Letters presented some
of these results, including the total area in permanent shadow above 65°N,
approximately 1800 km2 (~0.13% of the total hemisphere in terms of
area).
The publication by Schorghofer et al. (2016) in Geophysical Research Letters presented some
of these results, including the total area in permanent shadow above 65°N,
approximately 1800 km2 (~0.13% of the total hemisphere in terms of
area).
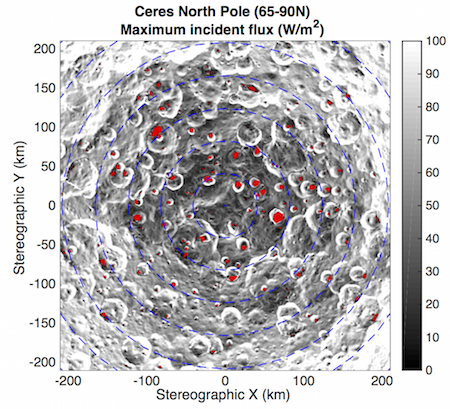
The maximum incident flux was
shown in map form as a background for their Figure 3, and is made available here in GMT/netcdf format. The binary
map of permanent shadow can be found here.
Additional maps are also
provided, namely the average incident flux over one rotation period at northern
solstice (link), and the average
incident flux over the whole Ceres year (link),
obtained from 12 discrete rotation
periods spread over its orbital period (~4.6
years).
These maps are presented in
stereographic north polar projection, using a projection radius of 470 km, with
a resolution of 500 m/pixel.
While these simulation results provided
the first evidence for permanent shadow at Ceres, the third body now known to
host them after the Moon and Mercury, their resolution was limited, in part due
to the reprojection of the original shape model data into stereographic
coordinates.
Additional simulations were
performed after the Schorghofer et al. (2016) work, in the Lambert Azimuthal
Equal-Area (LAEA) projection native to the stereo-photogrammetric shape models
produced by the Dawn team members at the German aerospace agency (DLR). With a
resolution of ~140 m/pixel, these
provide finer details in the illumination maps. The total PSR area is slightly
revised, in
good agreement with the extensive image-based survey performed by Platz et al. (2017).
An updated map of average sun visibility at northern solstice, again in
GMT/netcdf format but in LAEA projection and 140 m/px resolution, is made available here.
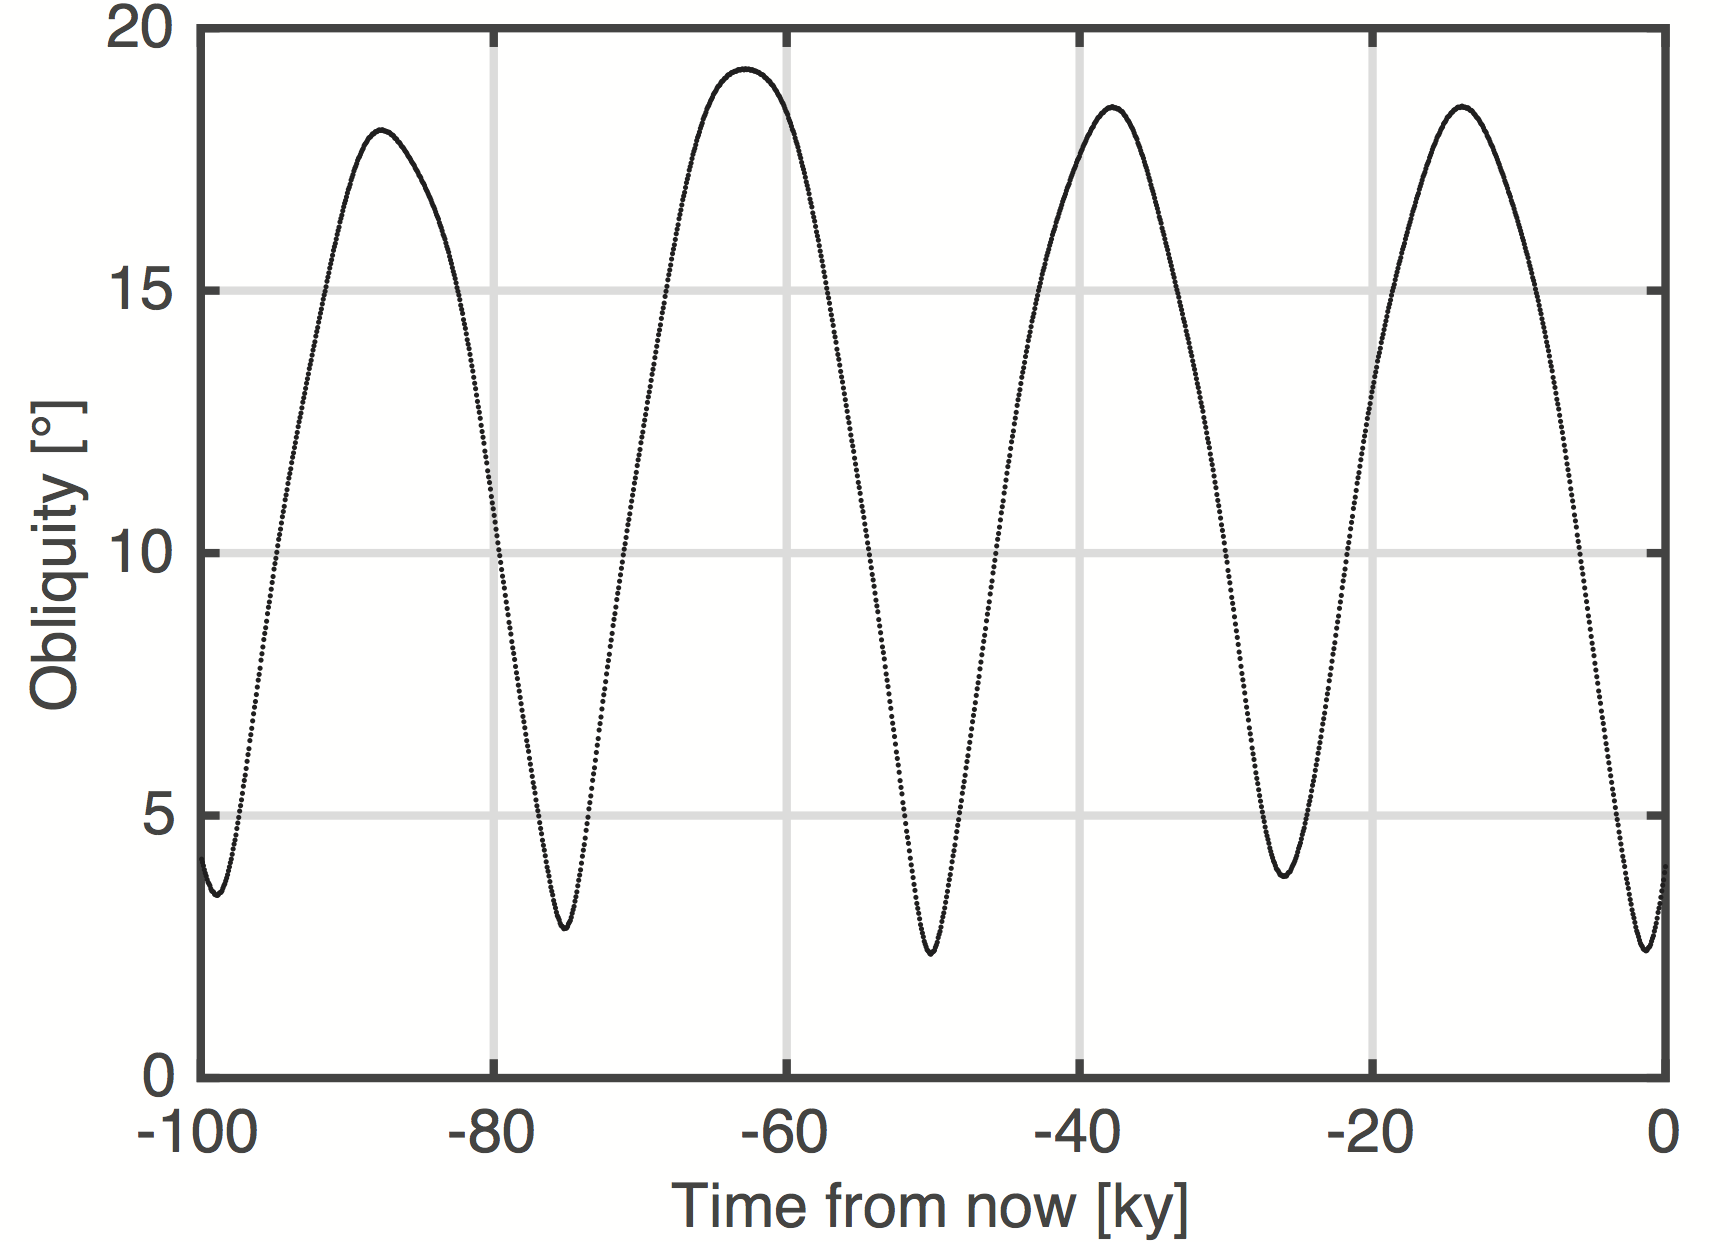
A follow-up study by Ermakov et al. (2017) examined the effects on permanent shadow of large periodic variations in the Ceres’ obliquity due to the influence of Jupiter. Indeed, the obliquity of Ceres is shown to vary between ~2° and ~20° with a period of ~25 kyr. The current obliquity (~4°) thus leads to significantly more “PSR” area than what could be considered typical. The ‘permanently shadowed regions’ identified in earlier studies are thus not as long-lived as their counterparts on the Moon and Mercury (with no obliquity variations over such short timescales), and may be better described as ‘persistently shadowed regions’.
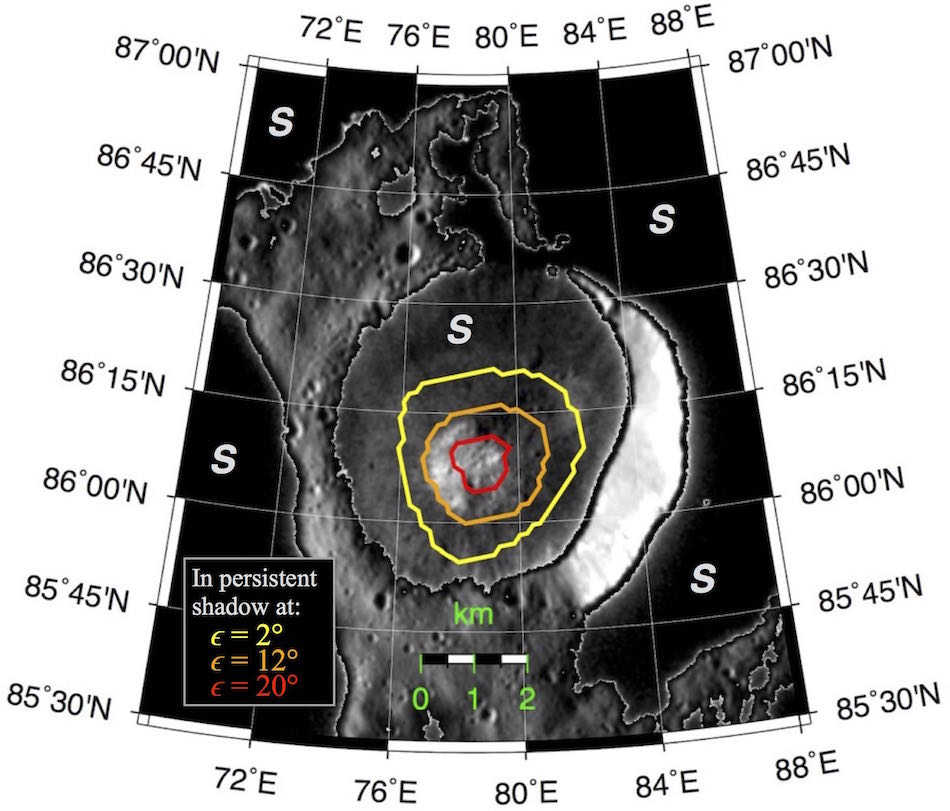 New simulations were conducted
over the 2°-20° obliquity range, in an effort to link the survival of PSRs at
20° obliquity with the few crater floors exhibiting bright deposits, first
identified by Platz et al. (2017). Here, we provide the maps of persistent
shadow over various obliquities, in the same LEAE projection and resolution as
above.
New simulations were conducted
over the 2°-20° obliquity range, in an effort to link the survival of PSRs at
20° obliquity with the few crater floors exhibiting bright deposits, first
identified by Platz et al. (2017). Here, we provide the maps of persistent
shadow over various obliquities, in the same LEAE projection and resolution as
above.
- average sun visibility at 2° obliquity (link)
- average sun visibility at 8° obliquity (link)
- average sun visibility at 12° obliquity (link)
- average sun visibility at 20° obliquity (link)
Citation
If you use the data provided here, please use the appropriate reference below.
References
- Schorghofer, N., E. Mazarico, T. Platz, F. Preusker, S. E. Schroeder, C. A. Raymond, and C. T. Russell. "The permanently shadowed regions of dwarf planet Ceres", Geophysical Research Letters, 43, 6783-6789, 2016. [10.1002/2016GL069368].
- Platz, T., A. Nathues, N. Schorghofer, F. Preusker, E. M. Mazarico, S. E. Schroeder, T. Kneissl, N. Schmedemann, J.-P. Combe, S. Byrne, M. Schaefer, G. S. Thangjam, M. Hoffmann, P. Gutierrez-Marques, M. Landis, J. Ripken, K.-D. Matz, and C. T. Russell. 2016. "Surface Water Ice Deposits in Ceres' Northern Shadowed Regions." Nature Astronomy [10.1038/s41550-016-0007].
- Ermakov, A. I. , E. Mazarico, S. E. Schröder, U. Carsenty, N. Schorghofer, F. Preusker, C. A. Raymond, C. T. Russell, and M. T. Zuber. "Ceres’ obliquity history and its implications for the permanently shadowed regions", Geophysical Research Letters, 2017, in press, [10.1002/2016GL072250].
Press
Some of the results above were discussed in a NASA press release.
https://www.nasa.gov/feature/goddard/2016/dawn-maps-ceres-craters-where-ice-can-accumulate
https://www.jpl.nasa.gov/news/news.php?release=2017-081
A video was produced by the NASA GSFC Science Visualization Studio.
Visual Resources
A rendering of the PSRs produced by the NASA GSFC SVS. Please give appropriate credit when using.