The Whole MOLA Catalog
Gregory A Neumann
Introduction
The Mars Orbiter Laser Altimeter (MOLA) mapped the surface of the fourth planet from the Sun from September 15, 1997 to July 1, 2001, when the instrument timing oscillator failed. The Mars Global Surveyor mission, launched November 7, 1996, was the first successful laser altimetry mission beyond the Earth-Moon system, following the loss of the Mars Observer spacecraft in 1993. The altimeter accompanied developments at GSFC in airborne mapping lidar, the Clementine LIDAR (1994) mapping of the Moon, the Shuttle Laser Altimeter (1995), and the NEAR-Shoemaker Laser Rangefinder which reached asteroid 433 Eros in 2000.
Fig. 1. MOLA instrument with 50-cm-diameter folded reflective telescope, laser electronics assembly, and base.
Topography and Shape
MOLA produced the most precise topographic map of any planet including the Earth (70% ocean), mapping through the dense nocturnal clouds and dust storms. Almost 700 million individual laser footprints were assembled into a global map using precision orbit determination by the GEODYN software (Lemoine et al. 2001, gravity), and small residual offsets resulting from unmodeled spacecraft propulsive events were then corrected in a crossover analysis (Rowlands et al., 1999; Neumann et al., 2001), achieving an accuracy of ~1m radially and ~100 m in position (Duxbury et al. 2001, IAU), covering virtually every region now being probed by rovers. A secondary achievement of the altimeter was identification and measurement of the volume of water ice (Smith et al. 1998) and the seasonally-varying thickness of the Martian polar CO2 and H2O ice caps (Smith et al., 2001, snow), the cloud heights (Neumann et al. 2003a) and the surface slopes and roughness (Aharonson 1998, 2001; Kreslavsky, 1999, 2003; Neumannn 2003b).
Fig. 2. The USGS MC-6 quadrangle. The MOLA topographic coordinate frame is the basis for geologic mapping of Mars, and reveals many impact “ghost” craters and tectonic ridges, obscured by atmospheric haze in remote sensing images, such as the 200-km-diameter unnamed crater shown here in the center of Utopia Planitia.
Mars topography is planetopotentially defined, so that water, lava, rovers etc. will move downhill from higher to lower elevation. Lacking a convenient “sea level”, we employ an equipotential virtual surface whose mean radius at the equator of 3,396,000 meters is close to the average planetary radius at the equator. The Mars gravity potential model GMM-2, evaluated to degree and order 50, provides the distance of this level surface, or datum, from the center of mass of the planet. Unlike the terrestrial geoid, this datum varies by more than two kilometers relative to a hydrostatic ellipsoid of revolution, at its highest over the Tharsis rise and lowest in the Argyre and northern lowland basins (K. Beatty’s article in Sky Tel. How different is GMM3?). Topography in the mass-centered coordinate system produced for the first time by MOLA shows us that the hemispheric dichotomy in geology corresponds to a pole-to-pole slope of the topography from the southern highlands to the northern Borealis plains. The hemispheric dichotomy boundary in the Tempe and Arabia Terra region is marked by a trough in the gravity field (Smith et al. 2001; Genova et al. 2016) and truncation of valley networks (Hynek et al. 2010), but the boundary dips away from the Tharsis rise (Phillips et al., 2001) showing that topography has undergone substantial changes since the Noachian era when fluvial activity was widespread. The existence of an ancient ocean has been proposed (Head et al. 1999), but evidence of an ancient shoreline remains controversial, and is not supported by MOLA topography (Withers and Neumann, 2001).
Fig. 3. Topography of the western portion of the dichotomy boundary (after Genova et al., 2016), showing feature names. Fluvial drainage valley networks (Hynek et al. 2010) are shown in red. A topographic contour dipping 0.025° to the northeast away from the Tharsis rise is shown in black.
Data
Links to the PDS MEGDR at resolutions of 4, 16, 64 and 128 pixels per degree, as well as high-resolution polar stereographic maps:
http://geo.pds.nasa.gov/missions/mgs/megdr.html
Tools to access portions of the global dataset
http://ode.rsl.wustl.edu/mars/index.aspx
Raw Topography and Shape
The raw MOLA PEDR records may be decommutated using tools such as the legacy software “pedr2tab”, written in Fortran during the 1990s, discarding occasionally erroneous ground points and portions where attitude data was unavailable, but the most important resulting datasets are those which could be imported directly into applications to generate local digital elevation models. The final selection of position and height “point cloud” data (radius and topography), spanning the depths of the Hellas basin (-8200 m) and the highest point on Olympus Mons (21,300 m), for those who wish to make the highest possible resolution maps. These points may also be obtained from the above-mentioned PDS Orbital Data Explorer, although the PDS filters do not exclude as many points and may exhibit residual artifacts.
Here, we provide binary files for the ultimate MOLA point cloud:
- planetary radius (TAR file, ~13GB);
- topography (TAR file, ~13GB).
See the README files in these archives for description.
Fig. 4. Topography of the elliptical Hellas basin, extending more than 2300 km east-west, and over 8 km deep, with evidence of volcanic, fluvial and glacial activity revealed on its floor.
Cloud data
With any altimeter, a few percent of triggers result from signals other than ground, not all of which are noise, and by a process of elimination we have selected those most likely to be triggers off of clouds. The matched filter detection scheme preferably triggered on clouds in the longest (180 and 540 ns) filter channels 3 and 4, but surprisingly also detected very strong signals on filter channels 1 and 2 (20 and 60 ns) during the polar winter night. These clouds exhibited structure consistent with condensation of CO2 within the atmosphere driven by circulation and gravitational waves (Pettengill and Ford, 1998).
We provide the datasets for "cloud returns" as PDS-formatted table files, in one ZIP archive. The format description is here.
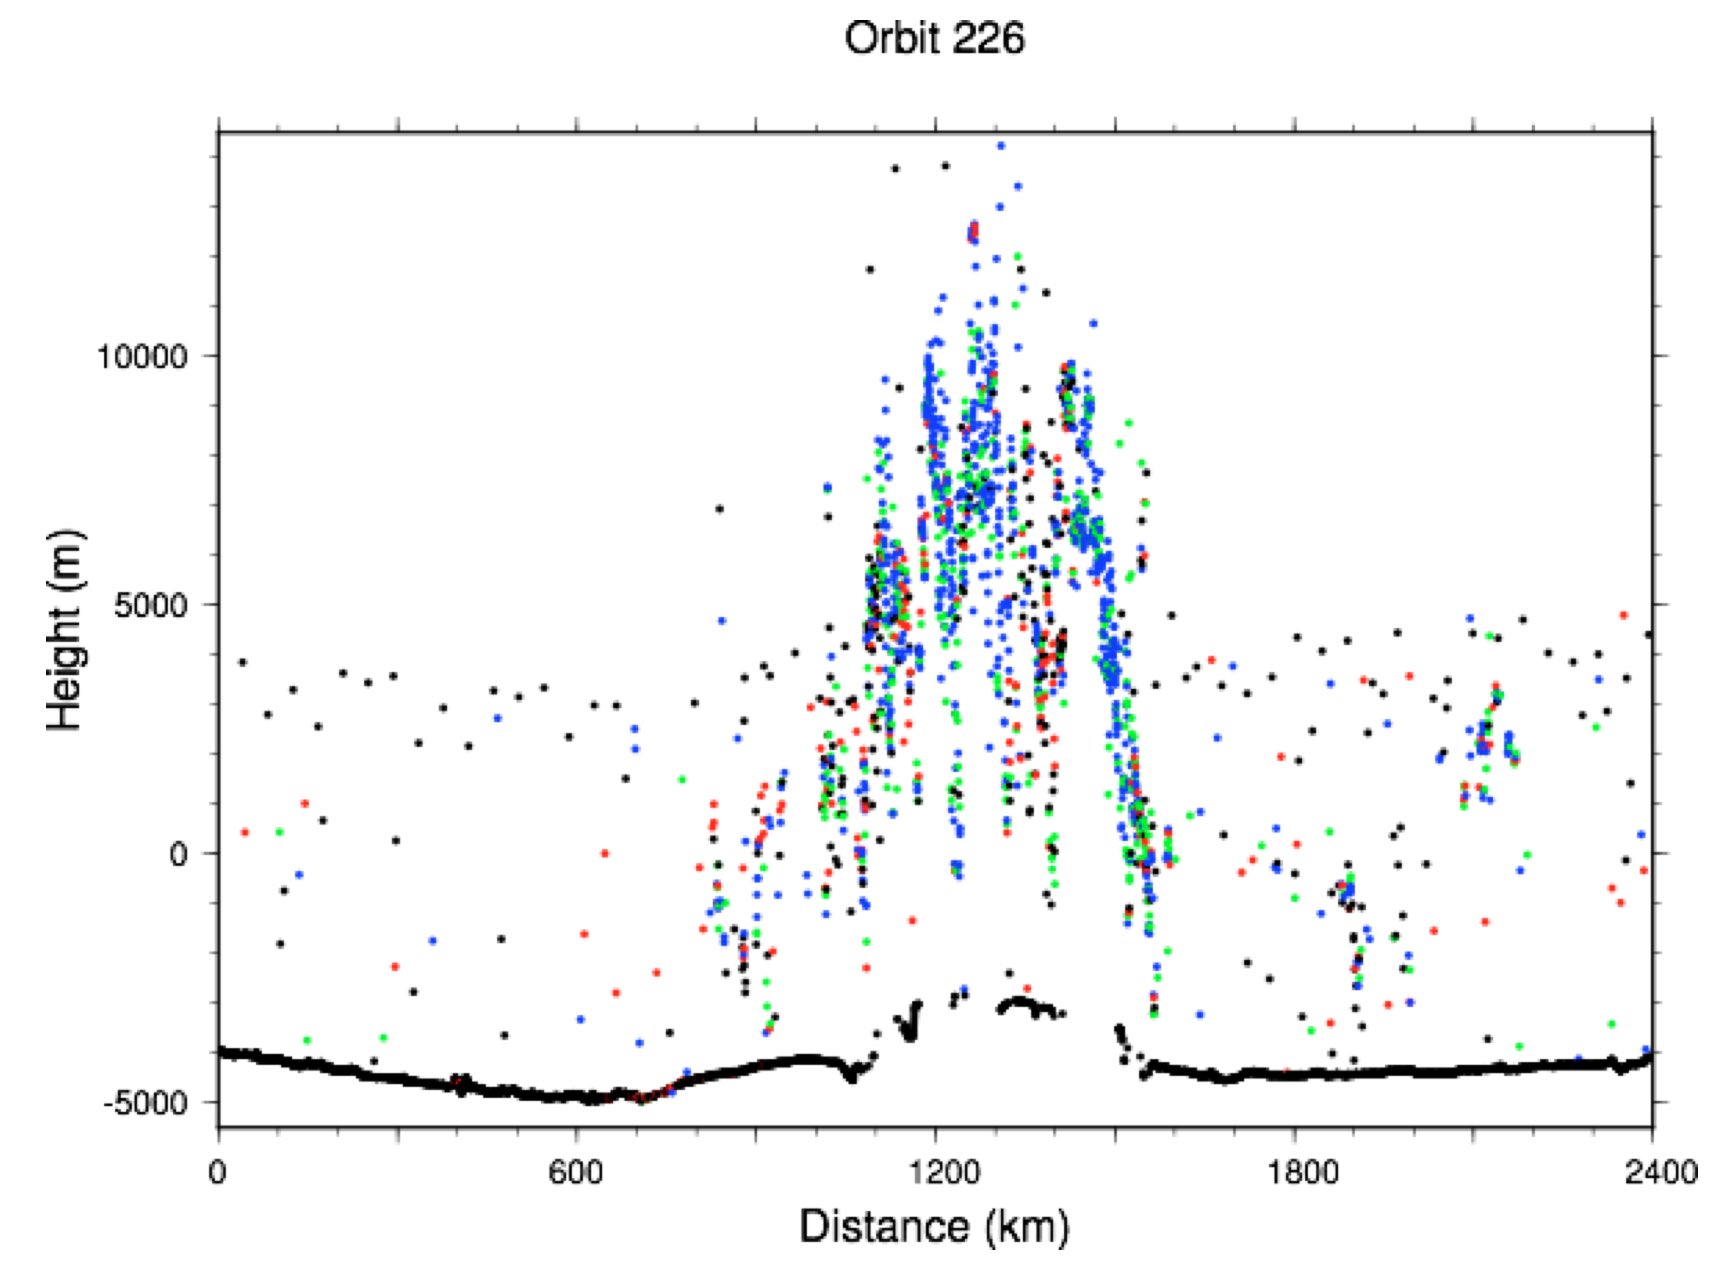
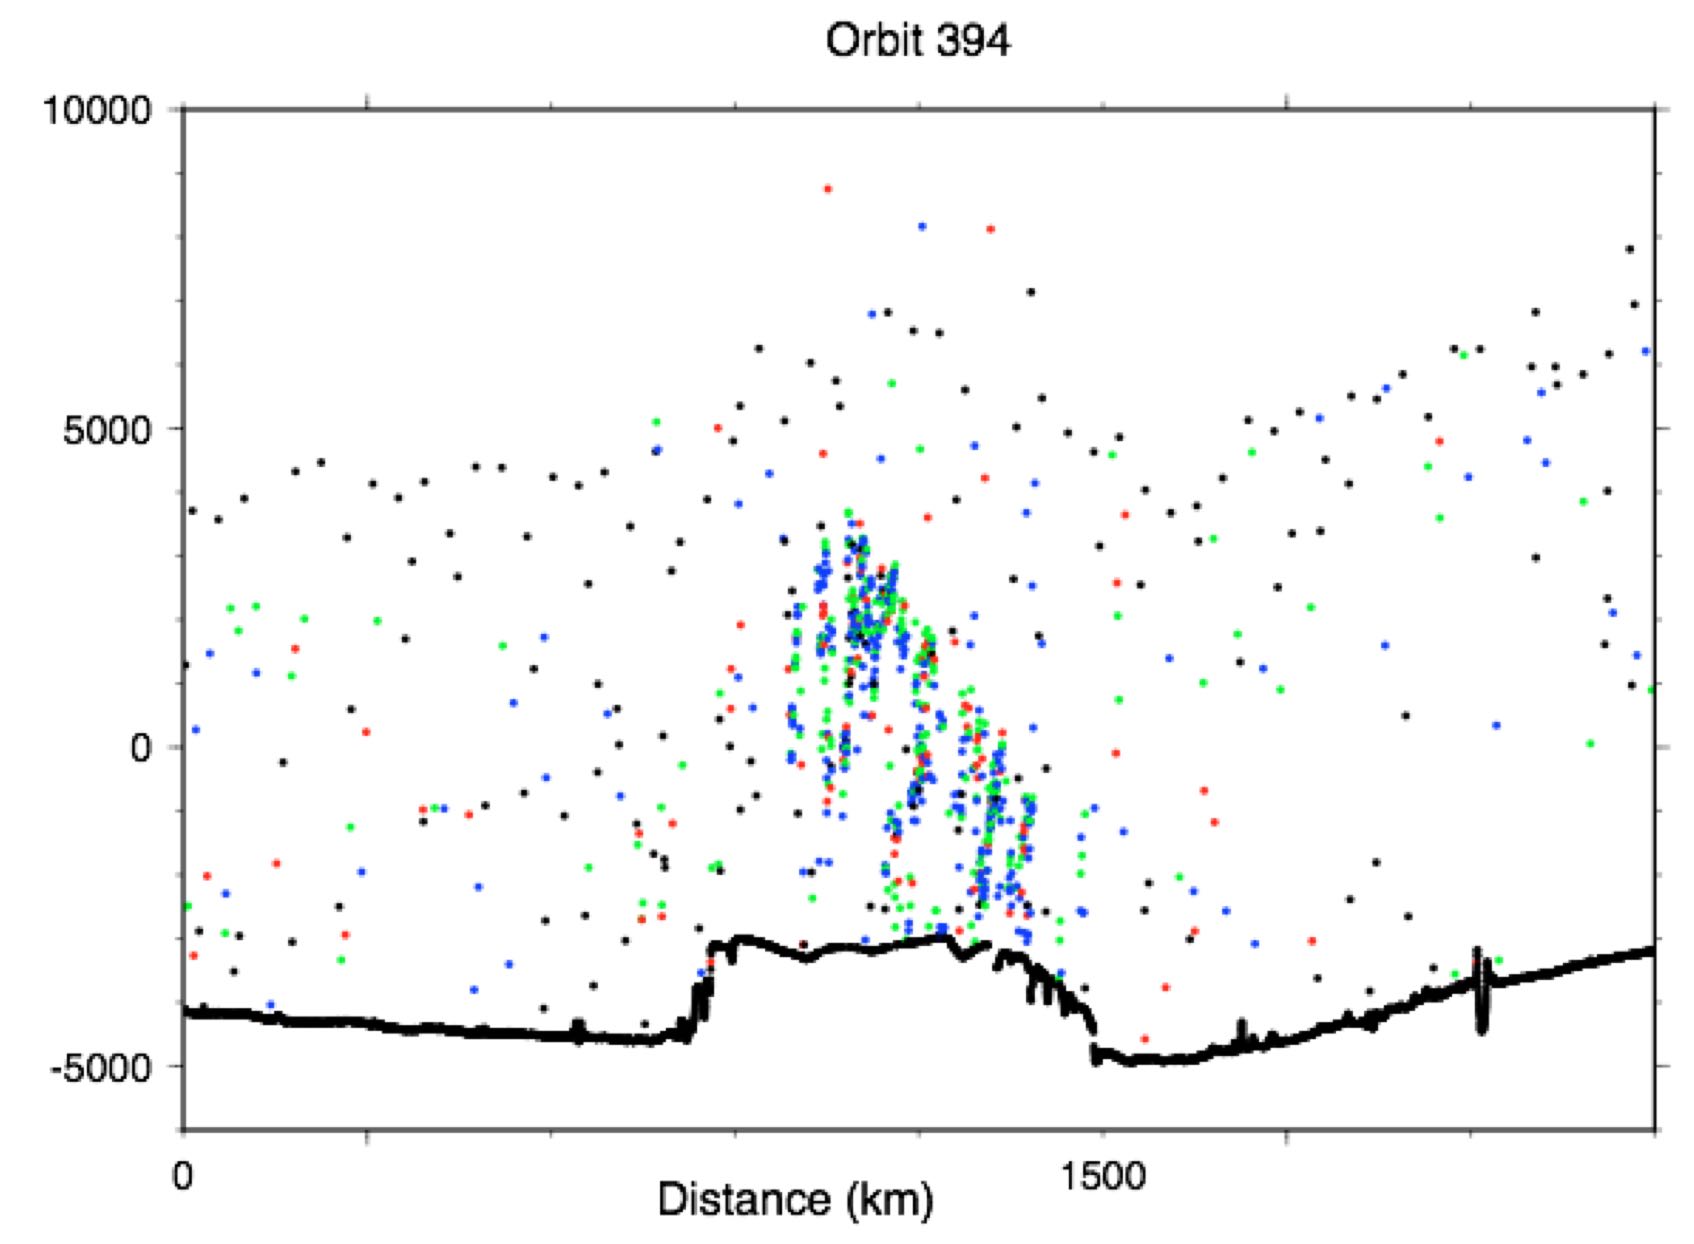
Fig. 5 (a,b) Two profiles over the north pole from Science Phasing orbits. Colors refer to matched filter channels 1-4 (black, red, green, blue). Clouds were observed in the polar winter night up to the range gate height limit at ~ 15 km above ground. Vertical exaggeration is approximately 100:1.
Mars Roughness
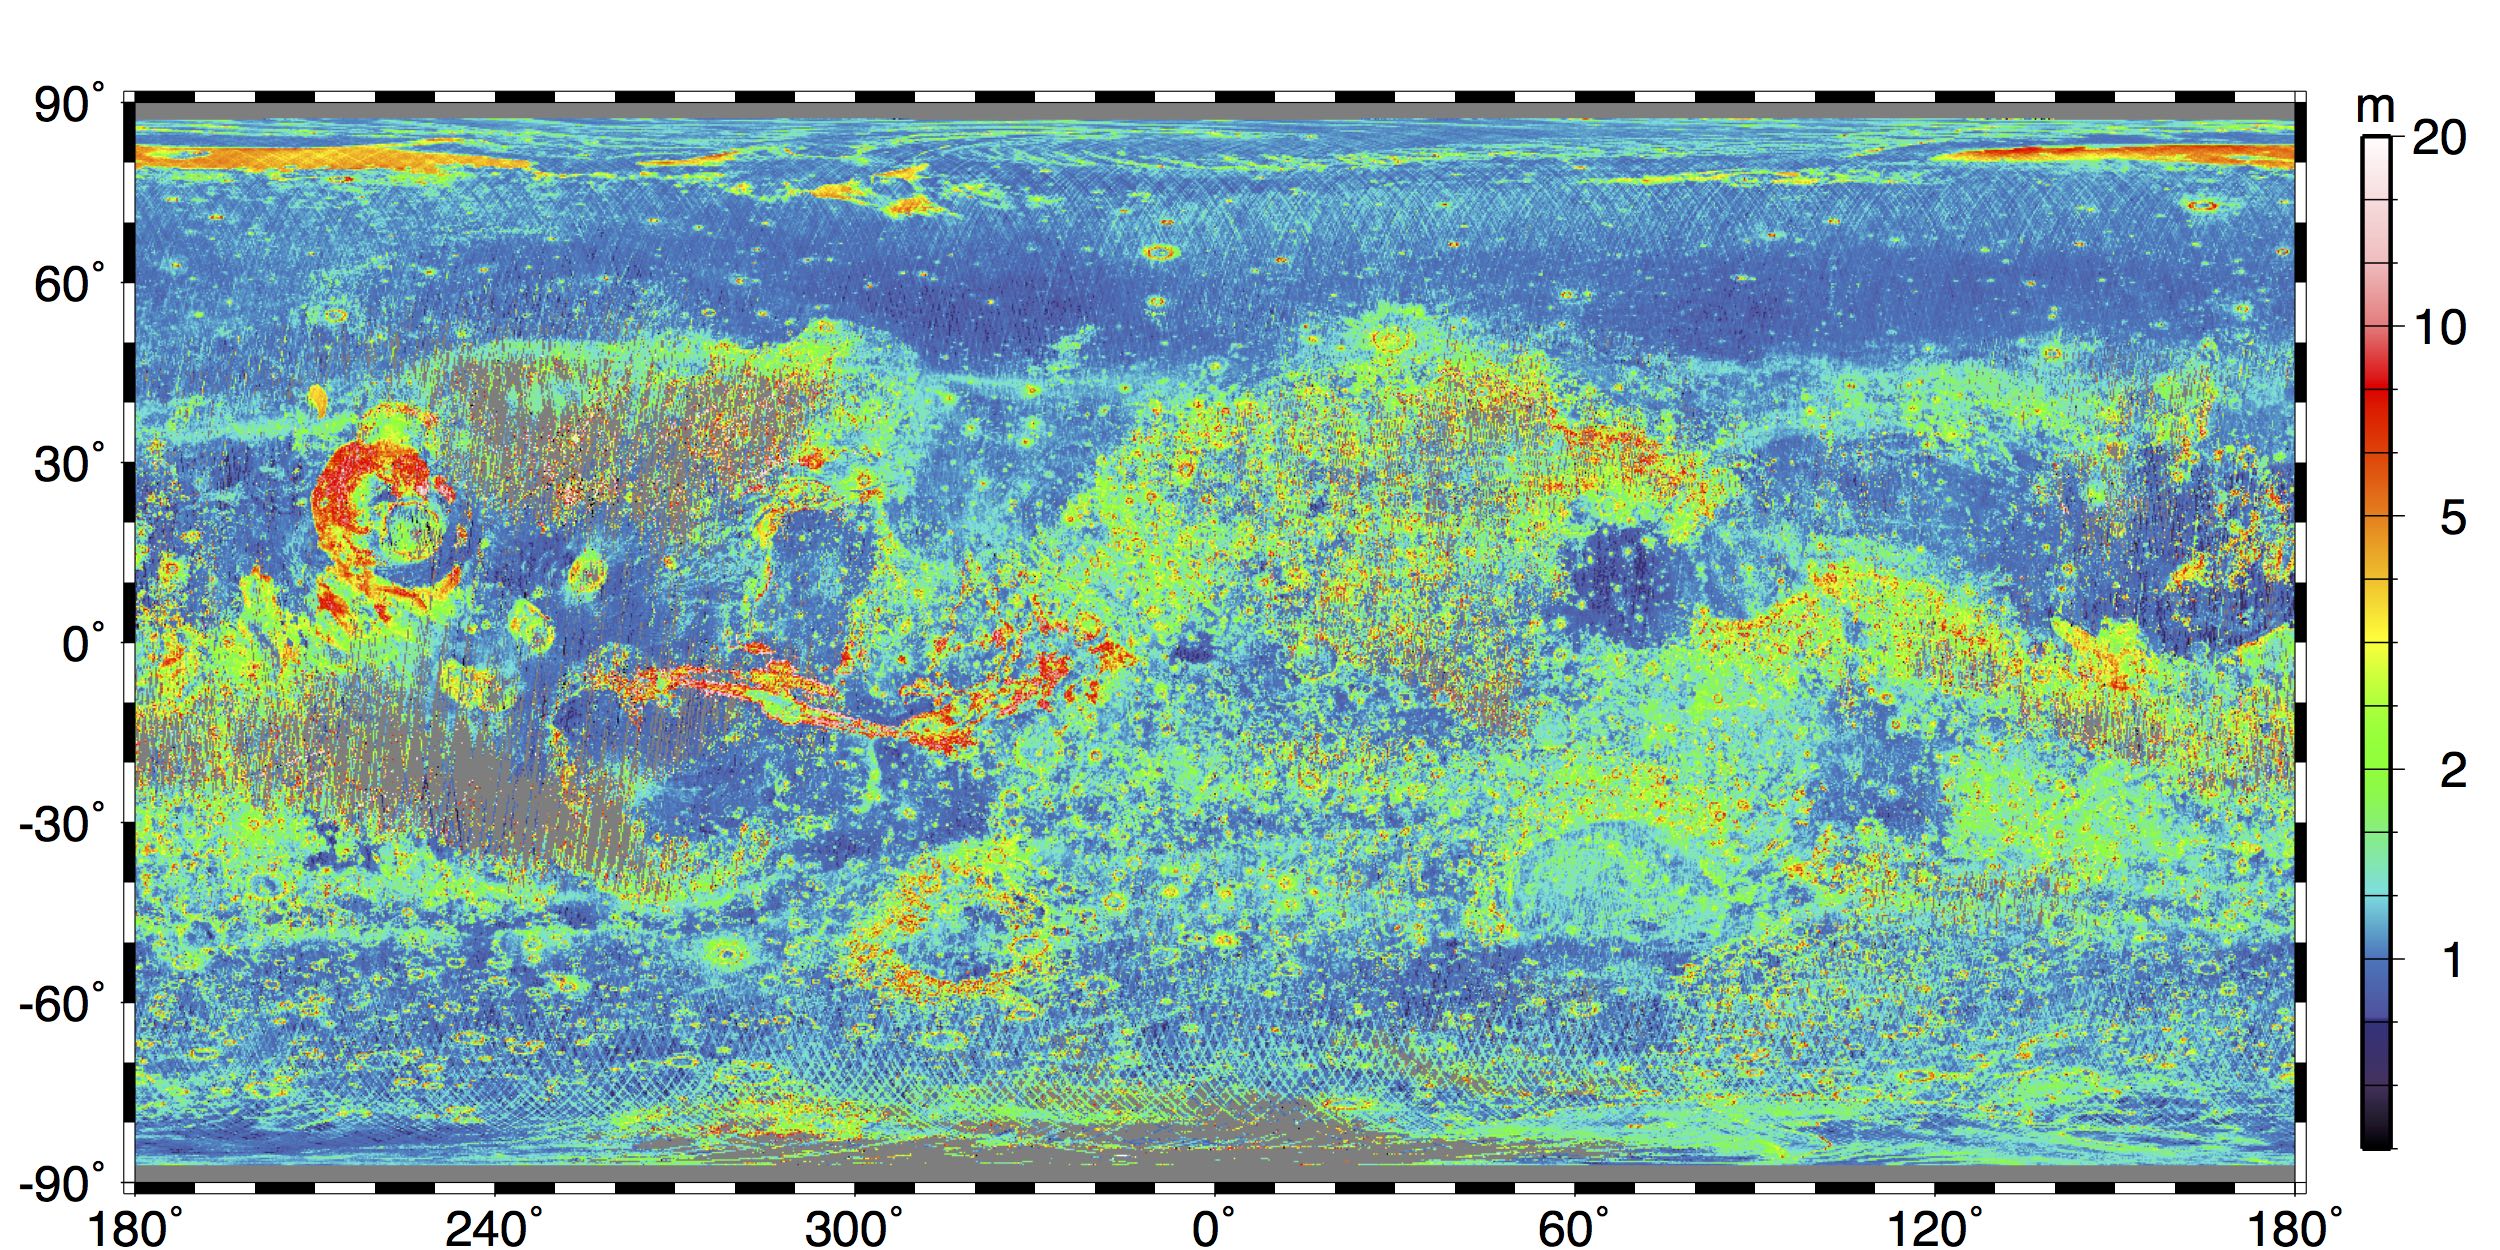
Fig. 6. Terrain RMS roughness after correcting for along-track slope, averaged over 1/4 by 1/4 degree regions from Neumann et al. 2003a. Logarithmically-spaced color scale shows rougher regions in warmer hues, while areas in gray lacked valid (unsaturated) data.
A latitudinal trend toward lower roughness both north and south has been noted previously in km-scale-baseline roughness (Kreslavsky and Head, 2000) and in correlation length scale (Aharonson et al., 2001). The mid-latitude transitional band of ~2 m roughness stretching north of Tharsis at 35–50°N and skirting Argyre and Hellas at 35–50°S has been attributed by Mustard et al. (2001) to devolatilization of ground ice during episodic climate change, leading to disrupted (polygonal etc.) terrain. Much of the roughened terrain in the smooth northern lowland plains is produced by eolian features.
Cylindrical projections at resolutions of 1, 4, and 8 pixels per degree are made available, in GMT format.
The maps used for the polar figures of Neumann et al. (2003) were produced in polar stereographic projection, from 70 degrees to the pole (gridline-registered, median-averaged) at an approximate resolution of 1.65 km. They can be downloaded in GMT format at the following links, for the North and the South polar regions.
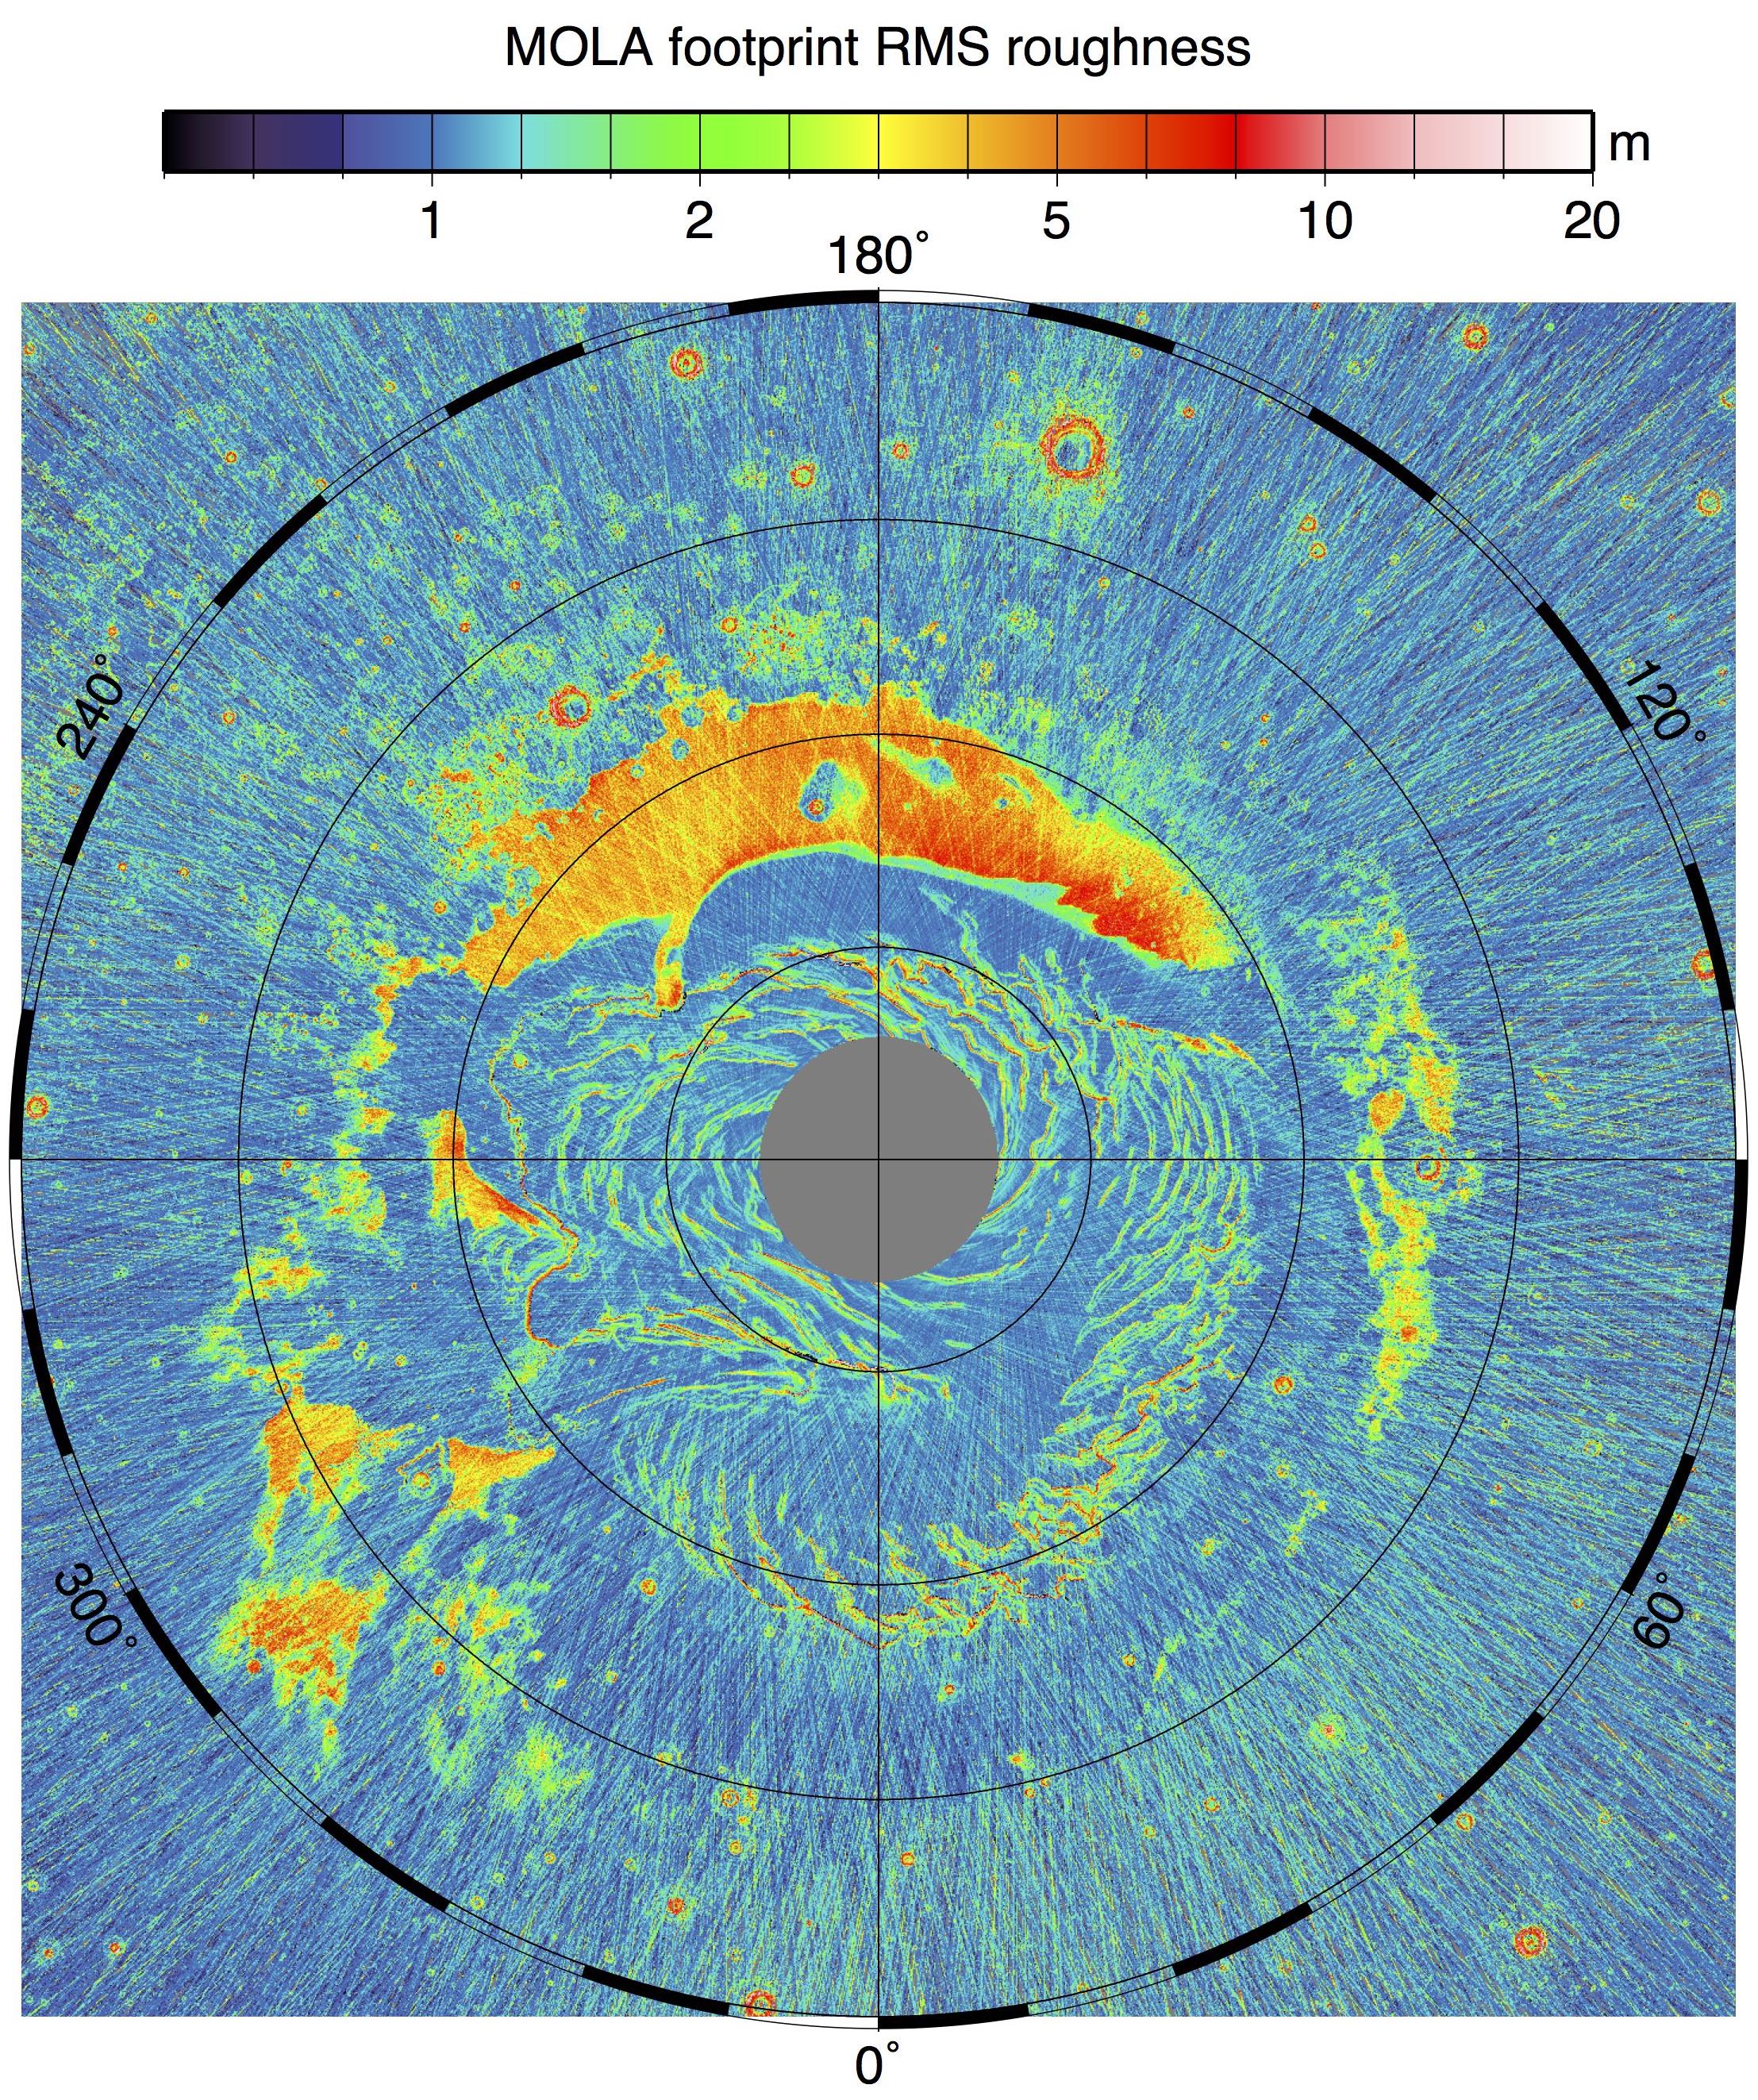
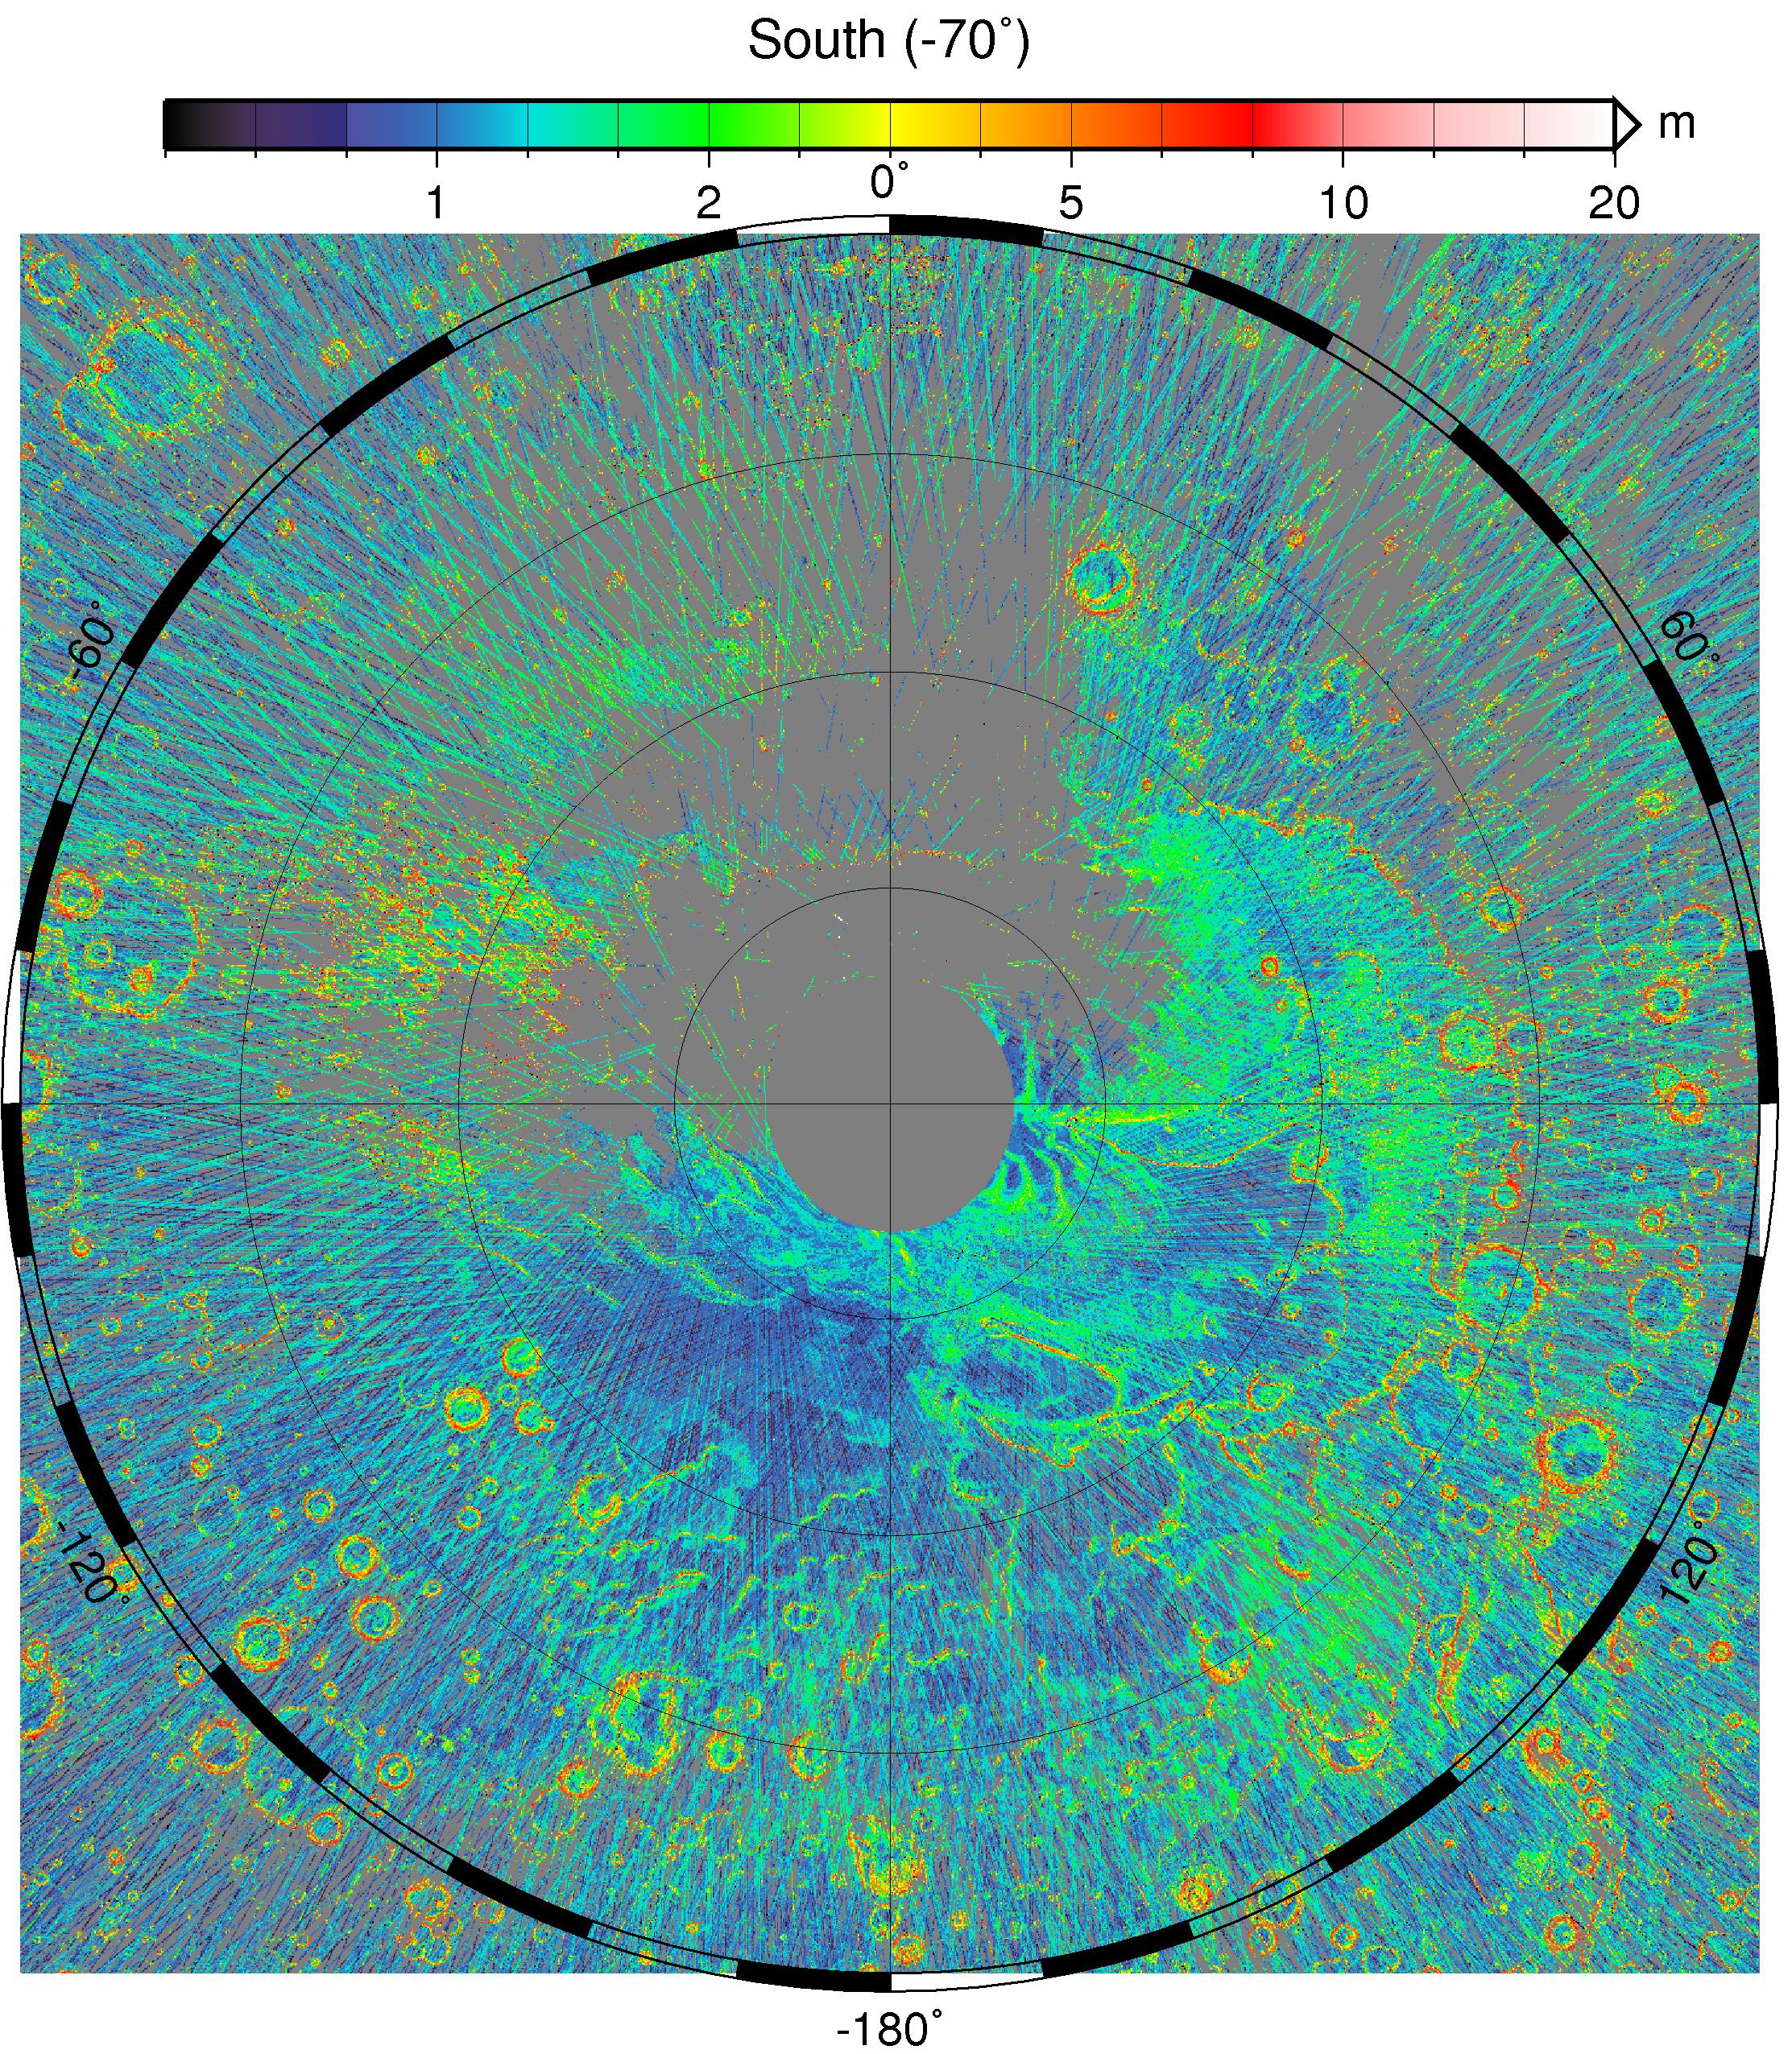
Fig. 7.The north polar stereographic roughness (left) shows the extremely rough crescentic dunes overlying a basal layer of ice. Both plots cover latitudes between 70 and 90 degrees N/S. The limited dynamic range of the pulsewidth monitors of MOLA causes gaps in coverage, especially in the south polar region.
In addition to these map products, the underlying slope-corrected roughness values obtained from the individual MOLA pulses are available here. Each file in this ZIP archive corresponds to the unsaturated pulses in a single MOLA PEDR, e.g., ap20327l.sc is the last day of altimetry. The slope-corrected MOLA pulsewidth data (bigendian binary triples, -biD3 in GMT) are in Mac/PPC byte order, as areocentric longitude/latitude/pulsewidth. The units of pulsewidth are nanoseconds. To convert to RMS meters one must divide these values by 6.67 (2.e9/c), from which the grids were created by median-averaging.
Citation:
If you use the data provided here, please use these references:
Topography and Shape maps: Smith, D. E., M. T. Zuber, H. V. Frey, J. B. Garvin, J. W. Head, D. O. Muhleman, G. H. Pettengill, R. .J. Phillips, S. C. Solomon, H .J. Zwally, W. B. Banerdt, T. C. Duxbury, M. P. Golombek, F. G. Lemoine, G. A. Neumann, D. D. Rowlands, O. Aharonson, P.G. Ford, A.B. Ivanov, P.J. McGovern, J.B. Abshire, R.S. Afzal, X. Sun (2001), Mars Orbiter Laser Altimeter: Experiment summary after the first year of global mapping of Mars, J. Geophys. Res., 106, 23,689–23,722.
Raw topography and shape point clouds: Neumann, G. A., D. E. Smith, M. T. Zuber, F. G. Lemoine, D. D. Rowlands (2001), The crossover analysis of Mars Orbiter Laser Altimeter (MOLA) data, J. Geophys. Res., 106, 23,753–23,768.
Slope-corrected roughness: Neumann, G. A., J. B. Abshire, O. Aharonson, J. B. Garvin, X. Sun, M. T. Zuber (2003a), Mars Orbiter Laser Altimeter pulse width measurements and footprint-scale roughness, Geophys. Res. Lett., 30(11), 1561, doi: 10.1029/2003GL017048.
Cloud data: Neumann, G. A., D. E. Smith, M. T. Zuber (2003b), Two Mars years of clouds detected by the Mars Orbiter Laser Altimeter, J. Geophys. Res., 108(E4), 5023, doi:10.1029.
References:
- Aharonson, O., M. T. Zuber, G. A. Neumann, J. W. Head (1998), Mars: Northern hemisphere slope distributions and stochastic properties of topography, Geophys. Res. Lett., 25, 4413–4416.
- Aharonson, O., Zuber, M. T., & Rothman, D. H. (2001). Statistics of Mars' topography from the Mars Orbiter Laser Altimeter: Slopes, correlations, and physical models. Journal of Geophysical Research: Planets, 106(E10), 23723-23735.
- Duxbury, T. C., P. Christensen, D. E. Smith, G. A. Neumann, R.L. Kirk, M. A. Caplinger, A. A. Albee, N. V. Seregina, G. Neukum (2014), The location of Airy-0, the Mars prime meridian reference, from stereo photogrammetric processing of THEMIS IR imaging and digital elevation data, J. Geophys. Res. Planets, 119, 2471–2486, doi:10.1002/2014JE004678.
- Duxbury, T. C., R. L. Kirk, B. A. Archinal, G. A. Neumann (2001), Mars Geodesy/Cartography Working Group recommendations on Mars cartographic constants and coordinate systems, Proc. ISPRS Working Group IV/9 Workshop "Planetary Mapping 2001"
- Head, J. W., Hiesinger, H., Ivanov, M. A., Kreslavsky, M. A., Pratt, S., & Thomson, B. J. (1999). Possible ancient oceans on Mars: evidence from Mars Orbiter Laser Altimeter data. Science, 286(5447), 2134-2137.
- Hynek, B. M., Beach, M., & Hoke, M. R. (2010). Updated global map of Martian valley networks and implications for climate and hydrologic processes. Journal of Geophysical Research: Planets, 115(E9).
- Kreslavsky, M. A., & Head, J. W. (1999). Kilometer-scale slopes on Mars and their correlation with geologic units: Initial results from Mars Orbiter Laser Altimeter (MOLA) data. Journal of Geophysical Research: Planets, 104(E9), 21911-21924.
- Kreslavsky, M. A., & Head, J. W. (2000). Kilometer-scale roughness of Mars- Results from MOLA data analysis. Journal of Geophysical Research, 105(E11), 26-695.
- Lemoine, F. G., D. D. Rowlands, D. E. Smith, D. S. Chinn, D. E. Pavlis, S. B. Luthcke, G. A. Neumann, M. T. Zuber (1999), Orbit determination for Mars Global Surveyor during mapping, AIAA, 99-328, Girdwood Alaska, August 16–19, 1999.
- Lemoine, F. G., D. E. Smith, D.D. Rowlands, M.T. Zuber, G. A. Neumann (2001), D.S. Chinn, and D.E. Pavlis, An improved solution of the gravity field of Mars (GMM-2B) from Mars Global Surveyor, J. Geophys. Res., 106, 23,359–23,376.
- Mustard, J. F., Cooper, C. D., & Rifkin, M. K. (2001). Evidence for recent climate change on Mars from the identification of youthful near-surface ground ice. Nature, 412(6845), 411-414.
- Neumann, G. A., D. E. Smith, M. T. Zuber, F. G. Lemoine, D. D. Rowlands (2001), The crossover analysis of Mars Orbiter Laser Altimeter (MOLA) data, J. Geophys. Res., 106, 23,753–23,768.
- Neumann, G. A., J. B. Abshire, O. Aharonson, J. B. Garvin, X. Sun, M. T. Zuber (2003a), Mars Orbiter Laser Altimeter pulse width measurements and footprint-scale roughness, Geophys. Res. Lett., 30(11), 1561, doi: 10.1029/2003GL017048.
- Neumann, G. A., D. E. Smith, M. T. Zuber (2003b), Two Mars years of clouds detected by the Mars Orbiter Laser Altimeter, J. Geophys. Res., 108(E4), 5023, doi:10.1029.
- Pettengill, G. H., & Ford, P. G. (2000). Winter clouds over the north Martian polar cap. Geophysical Research Letters, 27(5), 609-612.
- Phillips, R.J., Zuber, M.T., Solomon, S.C., et al., 2001. Ancient geodynamics and global-scale hydrology on Mars. Science 291, 2587–2591.
- Rowlands, D. D., D. E. Pavlis, F. G. Lemoine, G. A. Neumann, S. B. Luthke (1999), The use of laser altimetry in the orbit and attitude determination of Mars Global Surveyor, Geophys. Res. Lett., 26, 1191–1194.
- Smith, D. E., Zuber, M. T., Frey, H. V., Garvin, J. B., Head, J. W., Muhleman, D. O., ... & Banerdt, W. B. (1998). Topography of the northern hemisphere of Mars from the Mars Orbiter Laser Altimeter. Science, 279(5357), 1686-1692.
- Smith, D. E., M. T. Zuber, H. V. Frey, J. B. Garvin, J. W. Head, D. O. Muhleman, G. H. Pettengill, R. .J. Phillips, S. C. Solomon, H .J. Zwally, W. B. Banerdt, T. C. Duxbury, M. P. Golombek, F. G. Lemoine, G. A. Neumann, D. D. Rowlands, O. Aharonson, P.G. Ford, A.B. Ivanov, P.J. McGovern, J.B. Abshire, R.S. Afzal, X. Sun (2001), Mars Orbiter Laser Altimeter: Experiment summary after the first year of global mapping of Mars, J. Geophys. Res., 106, 23,689–23,722.
- Smith, D. E., Zuber, M. T., & Neumann, G. A. (2001). Seasonal variations of snow depth on Mars. Science, 294(5549), 2141-2146.
- Wilson, R.J., G. A. Neumann, M. D. Smith (2007), The diurnal variation and radiative influence of Martian water ice clouds, Geophys. Res. Lett., 34(2), doi: 10.1029/2006GL027976.
-Withers, P., and G. A. Neumann (2001), Enigmatic northern plains of Mars, Nature, 410, 651.
- Zuber, M. T., et al. (1992), The Mars Observer Laser Altimeter investigation, J. Geophys. Res., 97, 7781-7797.