Recalibrated MLA Radiometric Data Records
Gregory A NeumannThe Mercury Laser Altimeter (MLA) radiometric dataset presented here has been recalibrated to account for two systematic sources of error, the change in response with time, and a bias due to off-pointing. The dimensionless target surface reflectivity rs (at 1064 nm, relative to Lambertian) is determined by the lidar link equation: [Sun and Neumann, 2015]
Erx = Etx ?r (Ar /R2) (rs /?) (Eq. 1)
where Erx is the received signal pulse energy, Etx is the transmitted laser pulse energy, ?r is the receiver optics transmission, Ar is the receiver telescope aperture area, and R is range distance to target. The recalibration corrects for changes in optical transmission and for the slow degradation of the laser beam output with time, causing some of the return energy to fall outside the detector field of view. Surprisingly, the average reflectance from 60°N to 80°N increased slightly for the first 9 months, then started to decline, ultimately by a factor of two. This effect was not directly observed but became apparent as the maximum range of detection declined from ~1600 km to less than 1000 km. Starting a few months into mapping, the laser diode pump current required to fire the laser increased in duration by roughly 50% and then leveled off, over which time the measured laser output declined by roughly 25%. Thermal shutdown by flight software also occurred during the hottest orbital phases. These changes are evidence that the responsivity of the system was undergoing progressive damage, similar to the behavior of the Lunar Orbiter Laser Altimeter (LOLA) for which the damage has been directly observed by Earth telescopes over the course of eight years of operation and more than two billion shots fired on each of two lasers. The MLA laser output of 20 mJ was almost two orders of magnitude higher than LOLA, and its degradation was accordingly more rapid, becoming apparent after roughly 20 million shots.
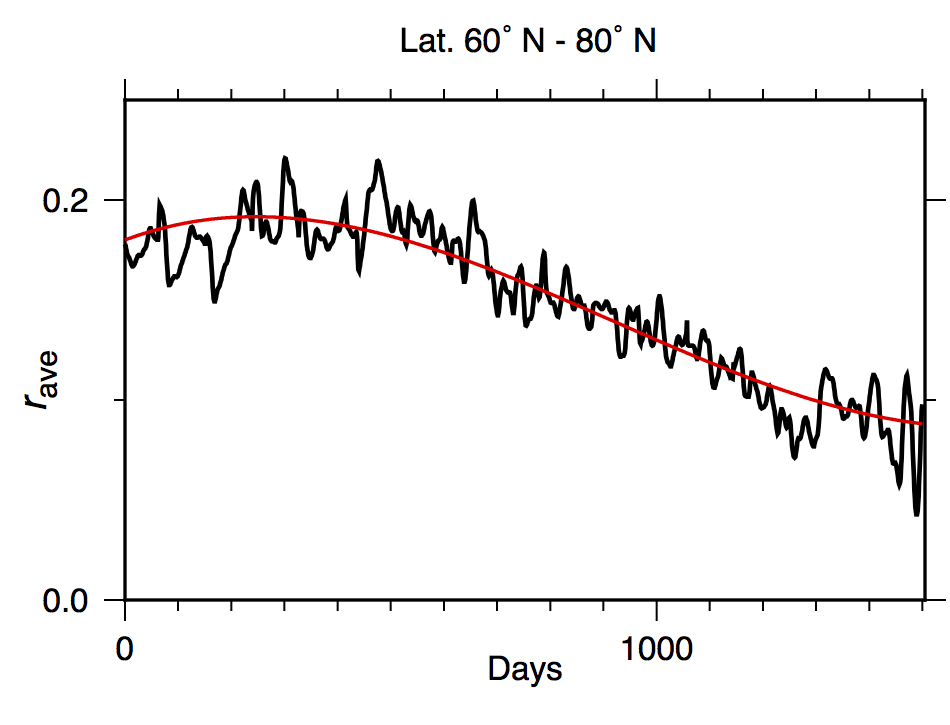
A polynomial fit
rave = A0 + A1 d + A2 d2 + A3 d3 (Eq. 2)
where A0 = 0.18; A1 = 1.e-04; A2 = -2.35e-07; A3 = 8.5e-11, averages out the variations in surface reflectance with longitude.
The scale factor A0/Rave is now applied to normalize the radiometry based on this cubic trend.
During the extended mission MLA ranged poleward of 84° N latitude in order to image the permanently shadowed areas hosting volatile deposits. The spacecraft orbit, resource contention and solar keep-in constraints limited such opportunities, but the most favorable conditions in general took place as the periapse altitude reached a maximum and the latitude of periapse also transitioned from the outbound to inbound legs. Observation campaigns in orbital mission years 2 and 3 are shown in Figure 2, where the poleward increase in emission angle is shown. In the “hot pole” longitudes (0 and 180 degrees) the dayside tracks also required substantial offpointing to keep within the sunshade at latitudes closer to the equator.
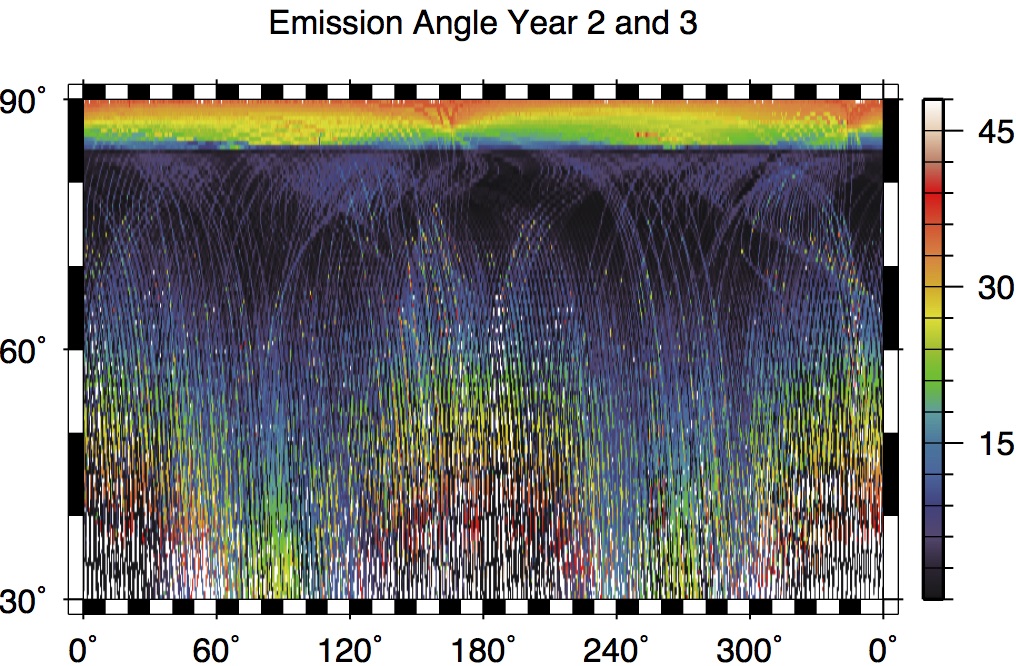
Figure 2. Emission angle of ascending and descending radiometry ground tracks, transitioning from nadir pointing at mid-latitudes to polar targeting above ~84°N.
In all configurations however a downward bias in reflectance was apparent due to the spreading of return pulses after interacting with surface topography at an oblique angle. This latter bias is of primary concern for measurements within the polar circle of 84° N latitude, the limiting latitude of the inclined MESSENGER orbits. All poleward measurements are necessarily oblique with ranges greater than the spacecraft altitude.
The two biases are somewhat coupled in that the laser beam was not as concentrated onto a single focused spot as when it was launched, so that the spreading of return pulses from oblique ranges worsened with age and the energy of each laser pulse reflected from the surface became stretched out over a longer duration.
The apparent downward bias was observed as both emission angles increased and as the slant range R increased, in a coupled fashion, suggesting that the spreading of pulses due to the combined effects of aging and oblique incidence was the controlling factor. Following Gardner [1992] we estimated pulse spreading from a linearized model of a circular footprint impinging at an angle onto a flat surface. The footprint diameter D, for an estimated 1/?e divergence ? = 0.024 mrad is D = 4 ? R. The electronic pulse spread is the root sum of squares of the laser pulsewidth itself (~2.8 ns) and the two-way light time differences over an oblique footprint, for a Gaussian beam of full width D at a given emission angle. The average reflectance vs pulse spread is shown in Figure 3.
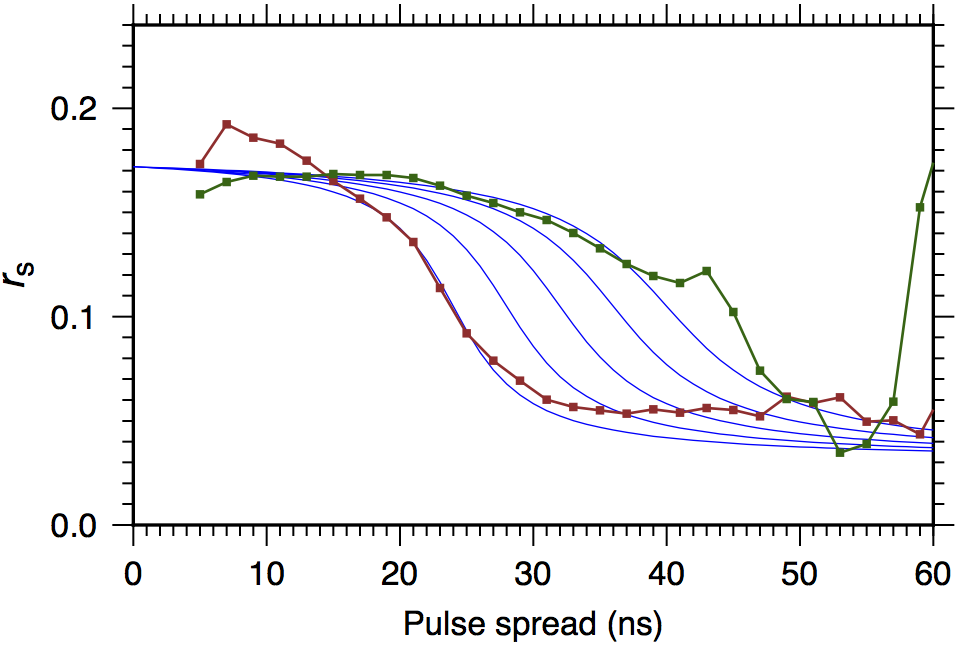
Figure 3. Averaged reflectance between 40° N and 83° N latitude, from months 3-7, 2011 (green) and months 1-6, 2012 (brown). An empirical family of sigmoidal functions (blue) was fit to the observations between 10 and 40 ns pulse spread, where the bulk of the data lie. As the laser beam degraded with time, the downward bias occurred at shorter ranges and lower emission angles.
At the narrowest pulsewidths, a unit scale factor was applied, and progressively larger corrections for bias at higher pulsewidths, proportional to the reciprocal of the sigmoidal functions. The family of functions has central transitions from 40 to 24 ns from the start of mapping to the end of the first year, remaining constant at 24 ns thereafter. The sharpness of the transition is 1/6 of the central value, given by
rave = 0.11 + 0.044 * atan2(center-i, sharp) (Eq. 3)
and the scale factor applied is 0.17/rave to compensate for bias.
The resulting polar stereographic maps of reflectance exhibit a gradual decrease with increasing latitude northward until 85.3° N, above which reflectance increases rapidly (Figure 4, after Neumann et al. [2017]). While permanently shadowed craters have been found to contain both bright deposits of water ice and darker sublimation lags of volatiles, much of the change in reflectance is due to the presence of small cold traps, whose surfaces expose deposits of volatiles outside of the large craters where such deposits were previously known [Deutsch et al., 2017].
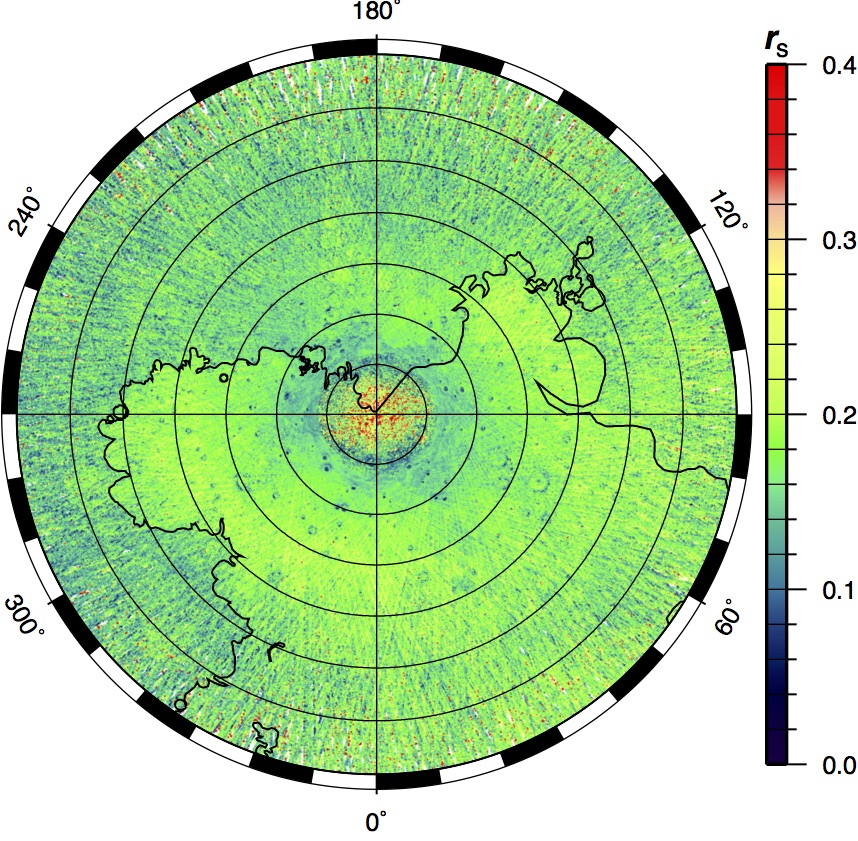
Figure 4. MLA zero-phase reflectance from four years of data 2011–2015, with outline of the mapped extent of the northern smooth plains, in polar stereographic projection 55°N to pole.
Data
The recalibrated MLA surface reflectance data described above, named MLA RADR v4, is available as a zipped archived here.
Citation
Please cite the Deutsch et al. [2017] reference (below) if you use this dataset in your work.
References
Deutsch, A. N., G. A. Neumann, J. W. Head (2017), New evidence for surface water ice in small-scale cold traps and in three large craters at the north polar region of Mercury from the Mercury Laser Altimeter, Geophysical Research Letters, in press.
Gardner, C. S. (1992), Ranging performance of satellite laser altimeters, IEEE Trans. Geosci. Remote Sens., 30, 1061–1072.
Neumann, G. A., X. Sun, E. Mazarico, A. N. Deutsch, J. W. Head, D. A. Paige, L. Rubanenko, and H. C. M. Susorney (2017), "Latitudinal Variations in Mercury's Reflectance from the Mercury Laser Altimeter." In Lunar and Planetary Science Conference, vol. 48, 2660.
Sun, X. and G. A. Neumann (2015), Calibration of the Mercury Laser Altimeter on the MESSENGER Spacecraft, IEEE Trans. Geosci. Rem. Sens., 53(5), 2860–2874, doi: 10.1109/TGRS.2014.2366080.
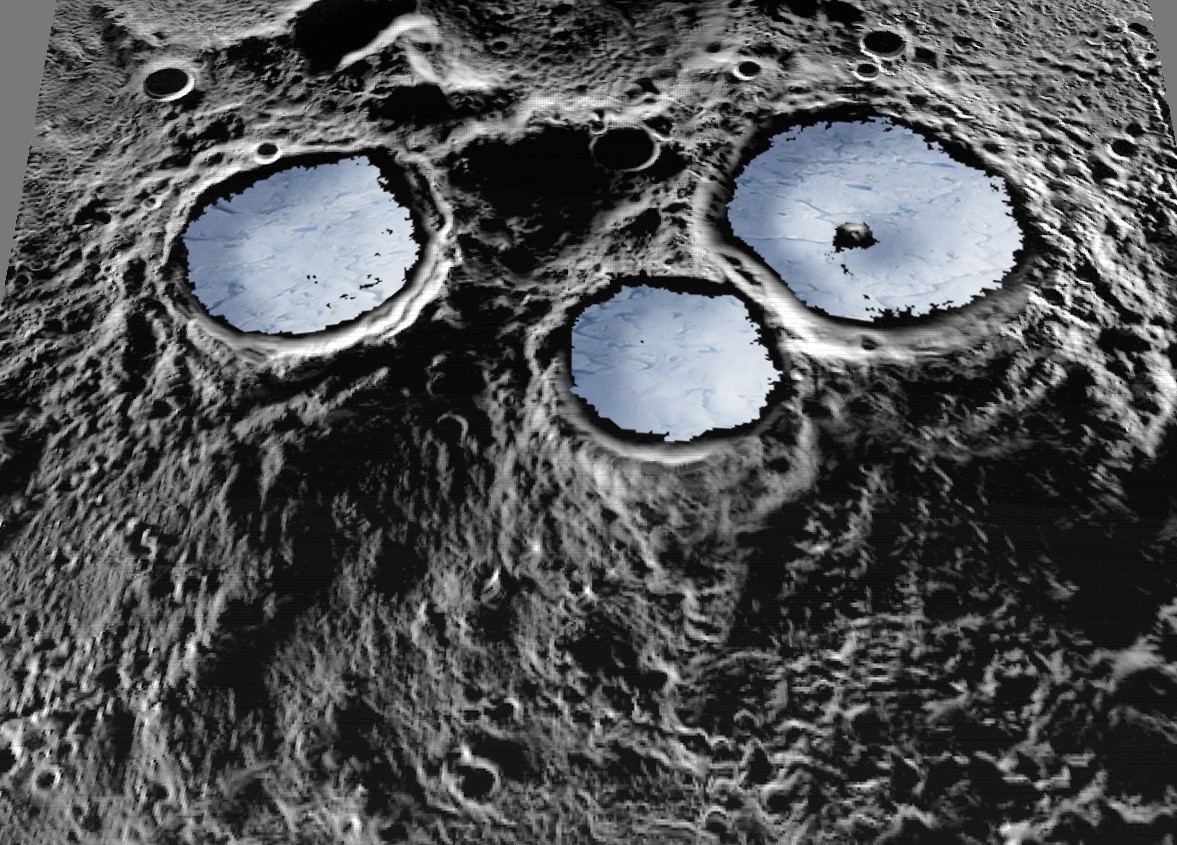
Caption: The Chesterton, Tolkien and Tryggvadóttir craters on Mercury, with an artist’s depiction of icy deposits.