Lunar Polar Illumination
Erwan Mazarico
The primary goal of the LOLA instrument onboard LRO was to map the topography of the Moon, but another important objective was to map the regions of permanent shadow.
This is best accomplished by modeling the illumination conditions of the entire lunar polar regions over long timescales. Although the LROC Wide-Angle Camera (WAC) was able to acquire large amounts of images of the poles at many different geometries covering the lunations and seasons (e.g., Speyerer et al., 2013), each WAC swath only covered part of each polar region, every two hours. And now that the LRO orbit inclination has substantially decreased, the immediate polar latitudes are less accessible.
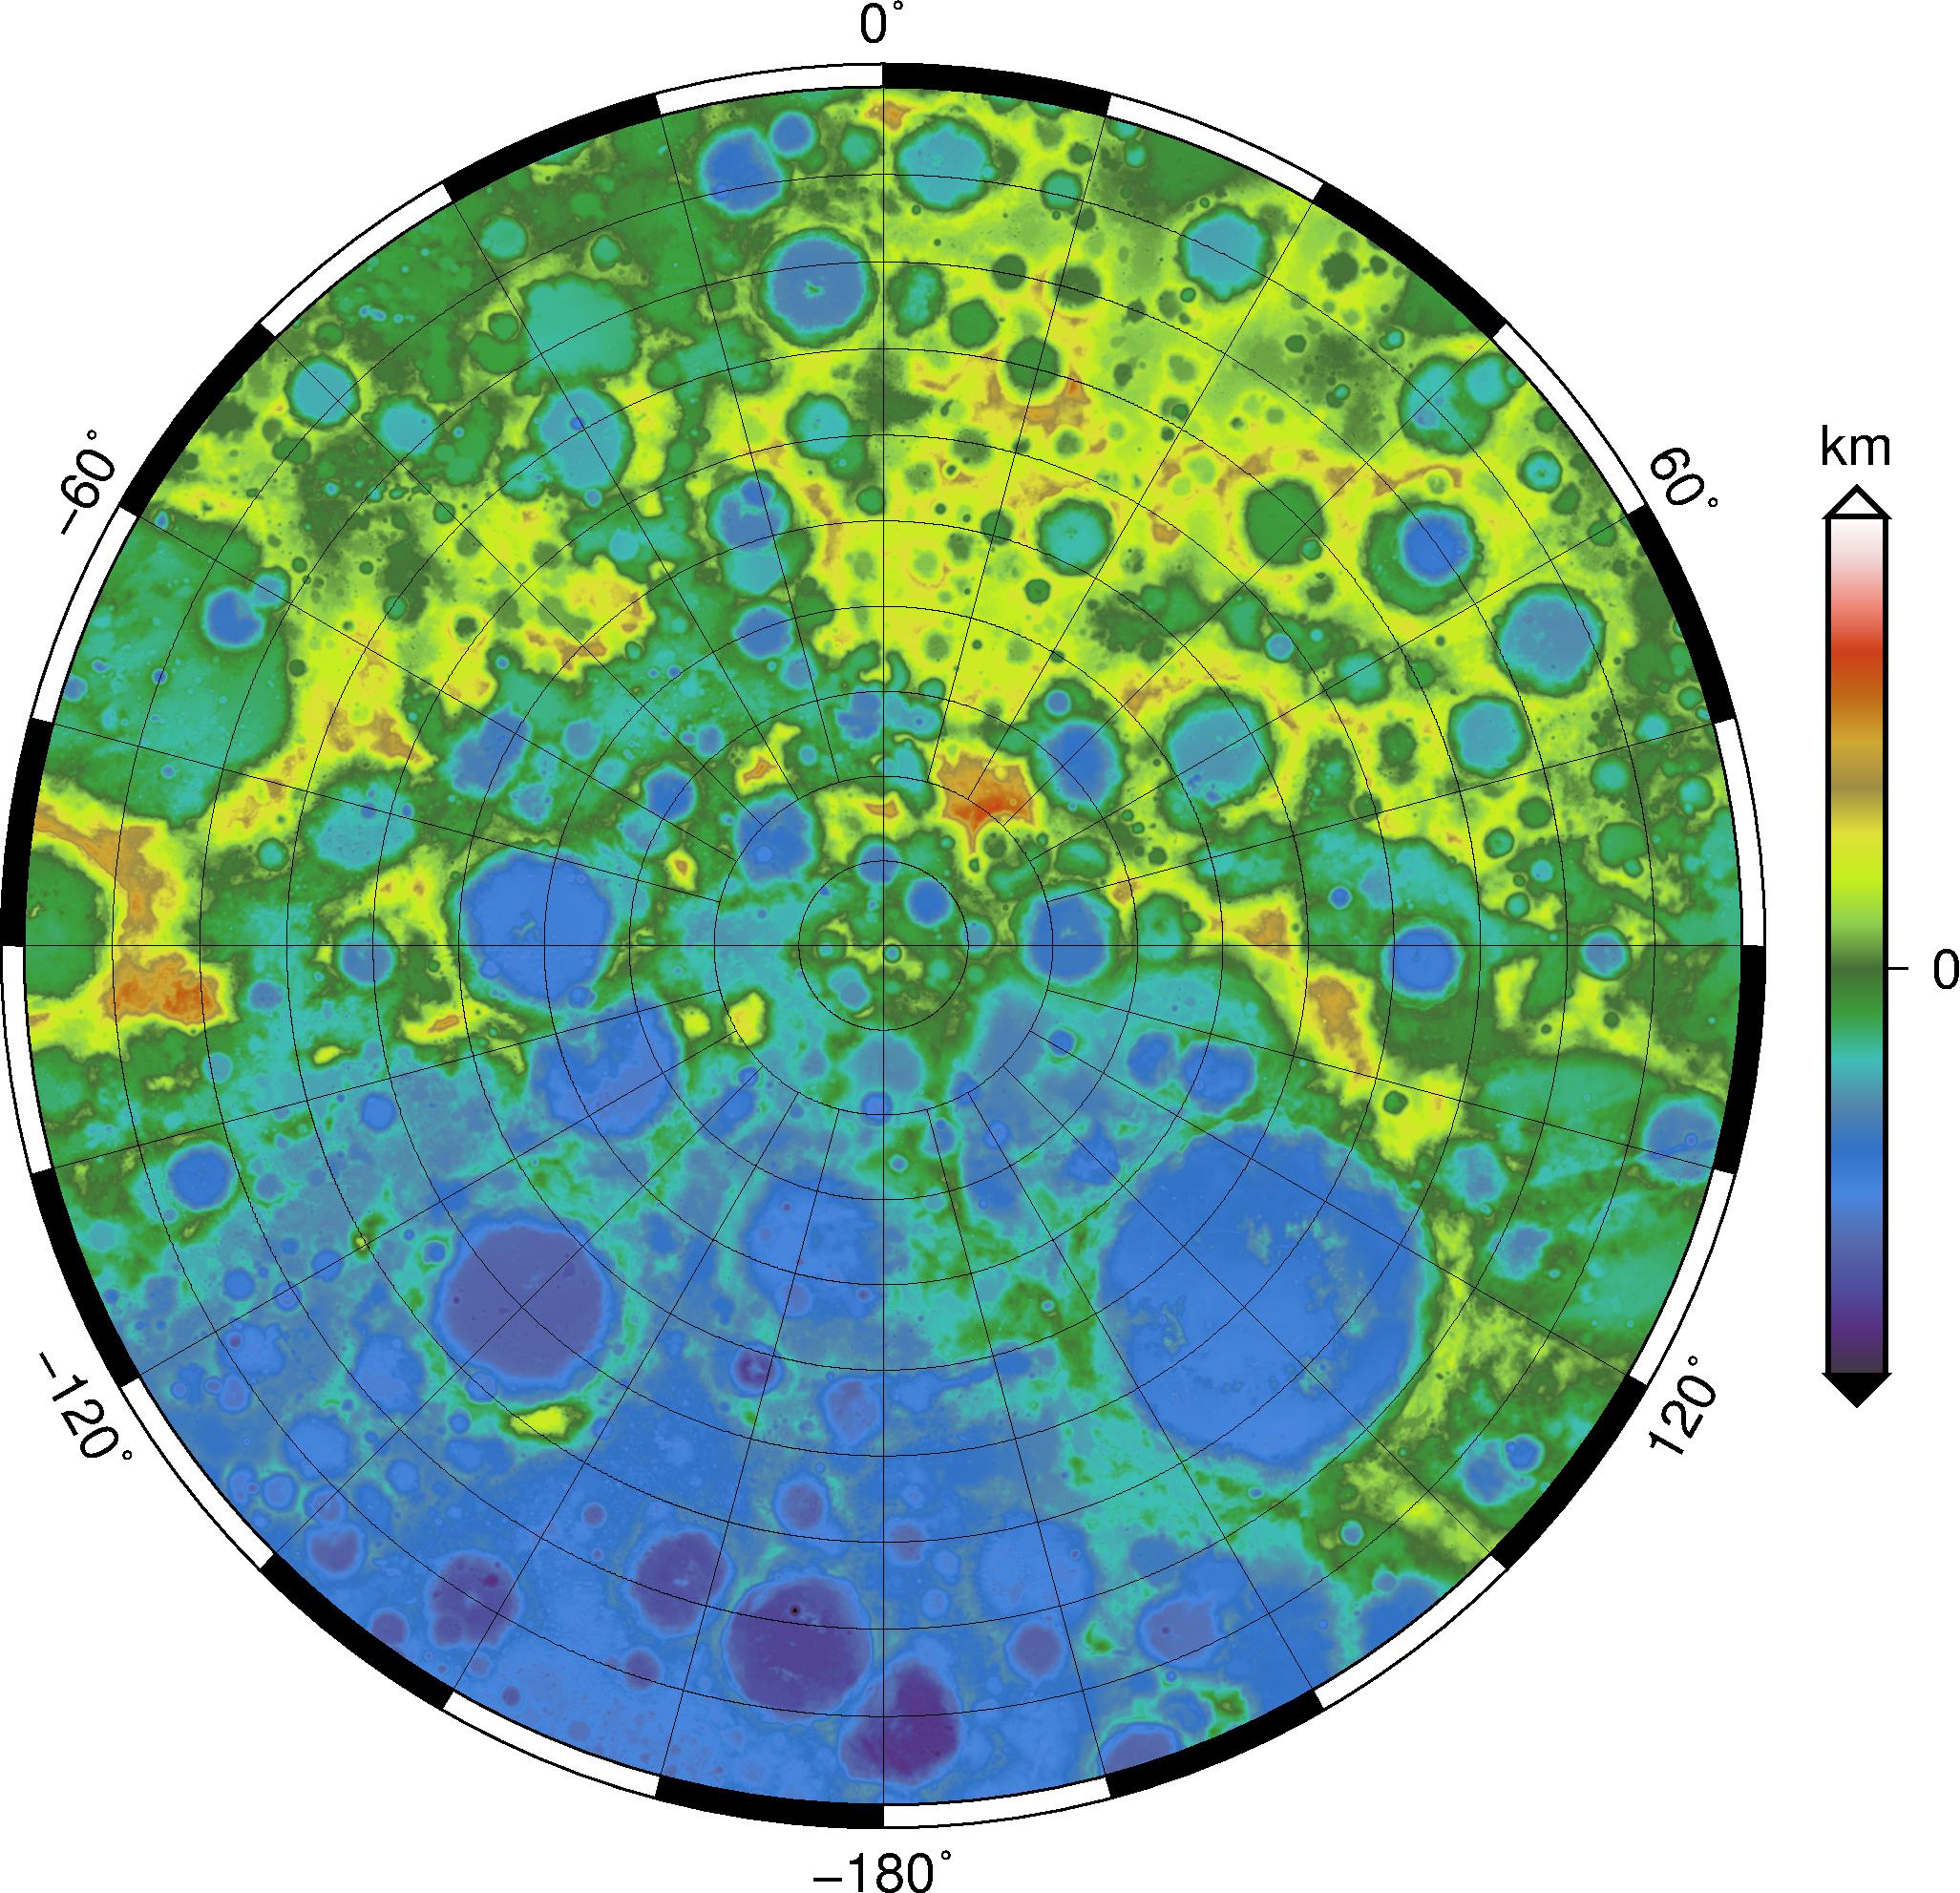

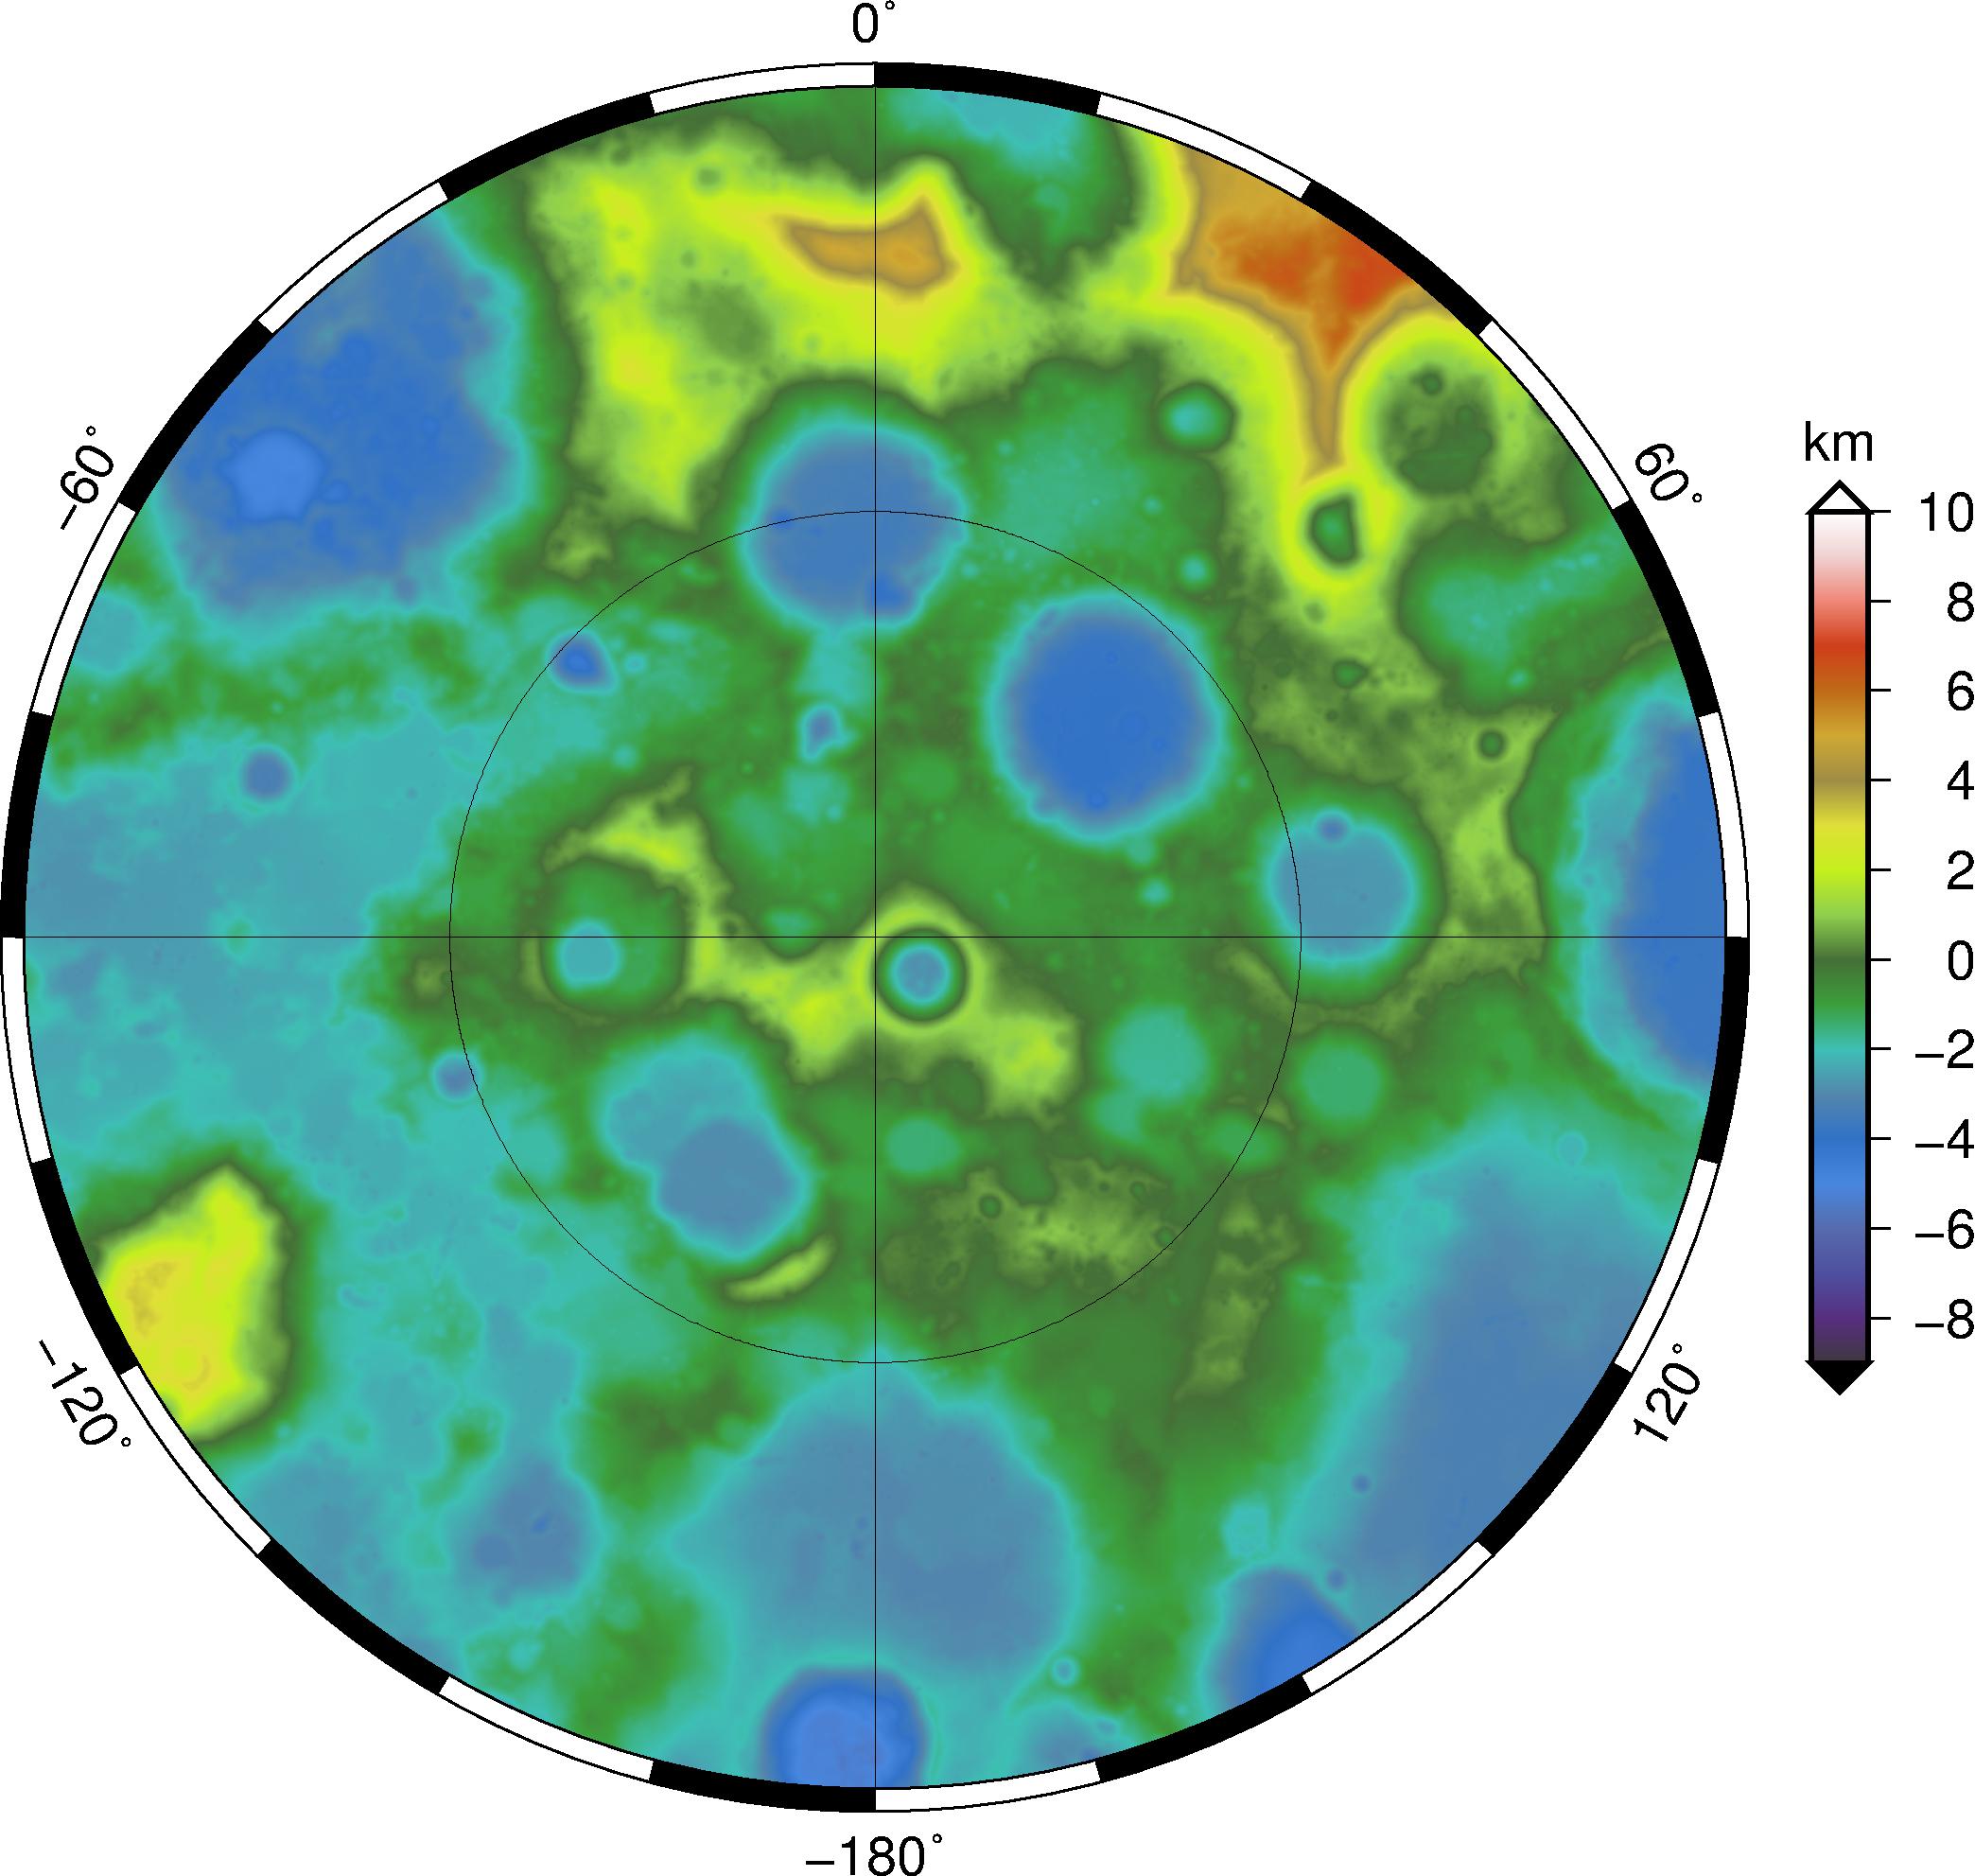
Figure 1. Elevation maps in the south polar region (referenced to a 1737.4 km sphere), in polar stereographic projection. Shown over
65S-90S (left, 240m/px), 80S-90S (center, 240m/px) and 85S-90S (center,
60m/px).
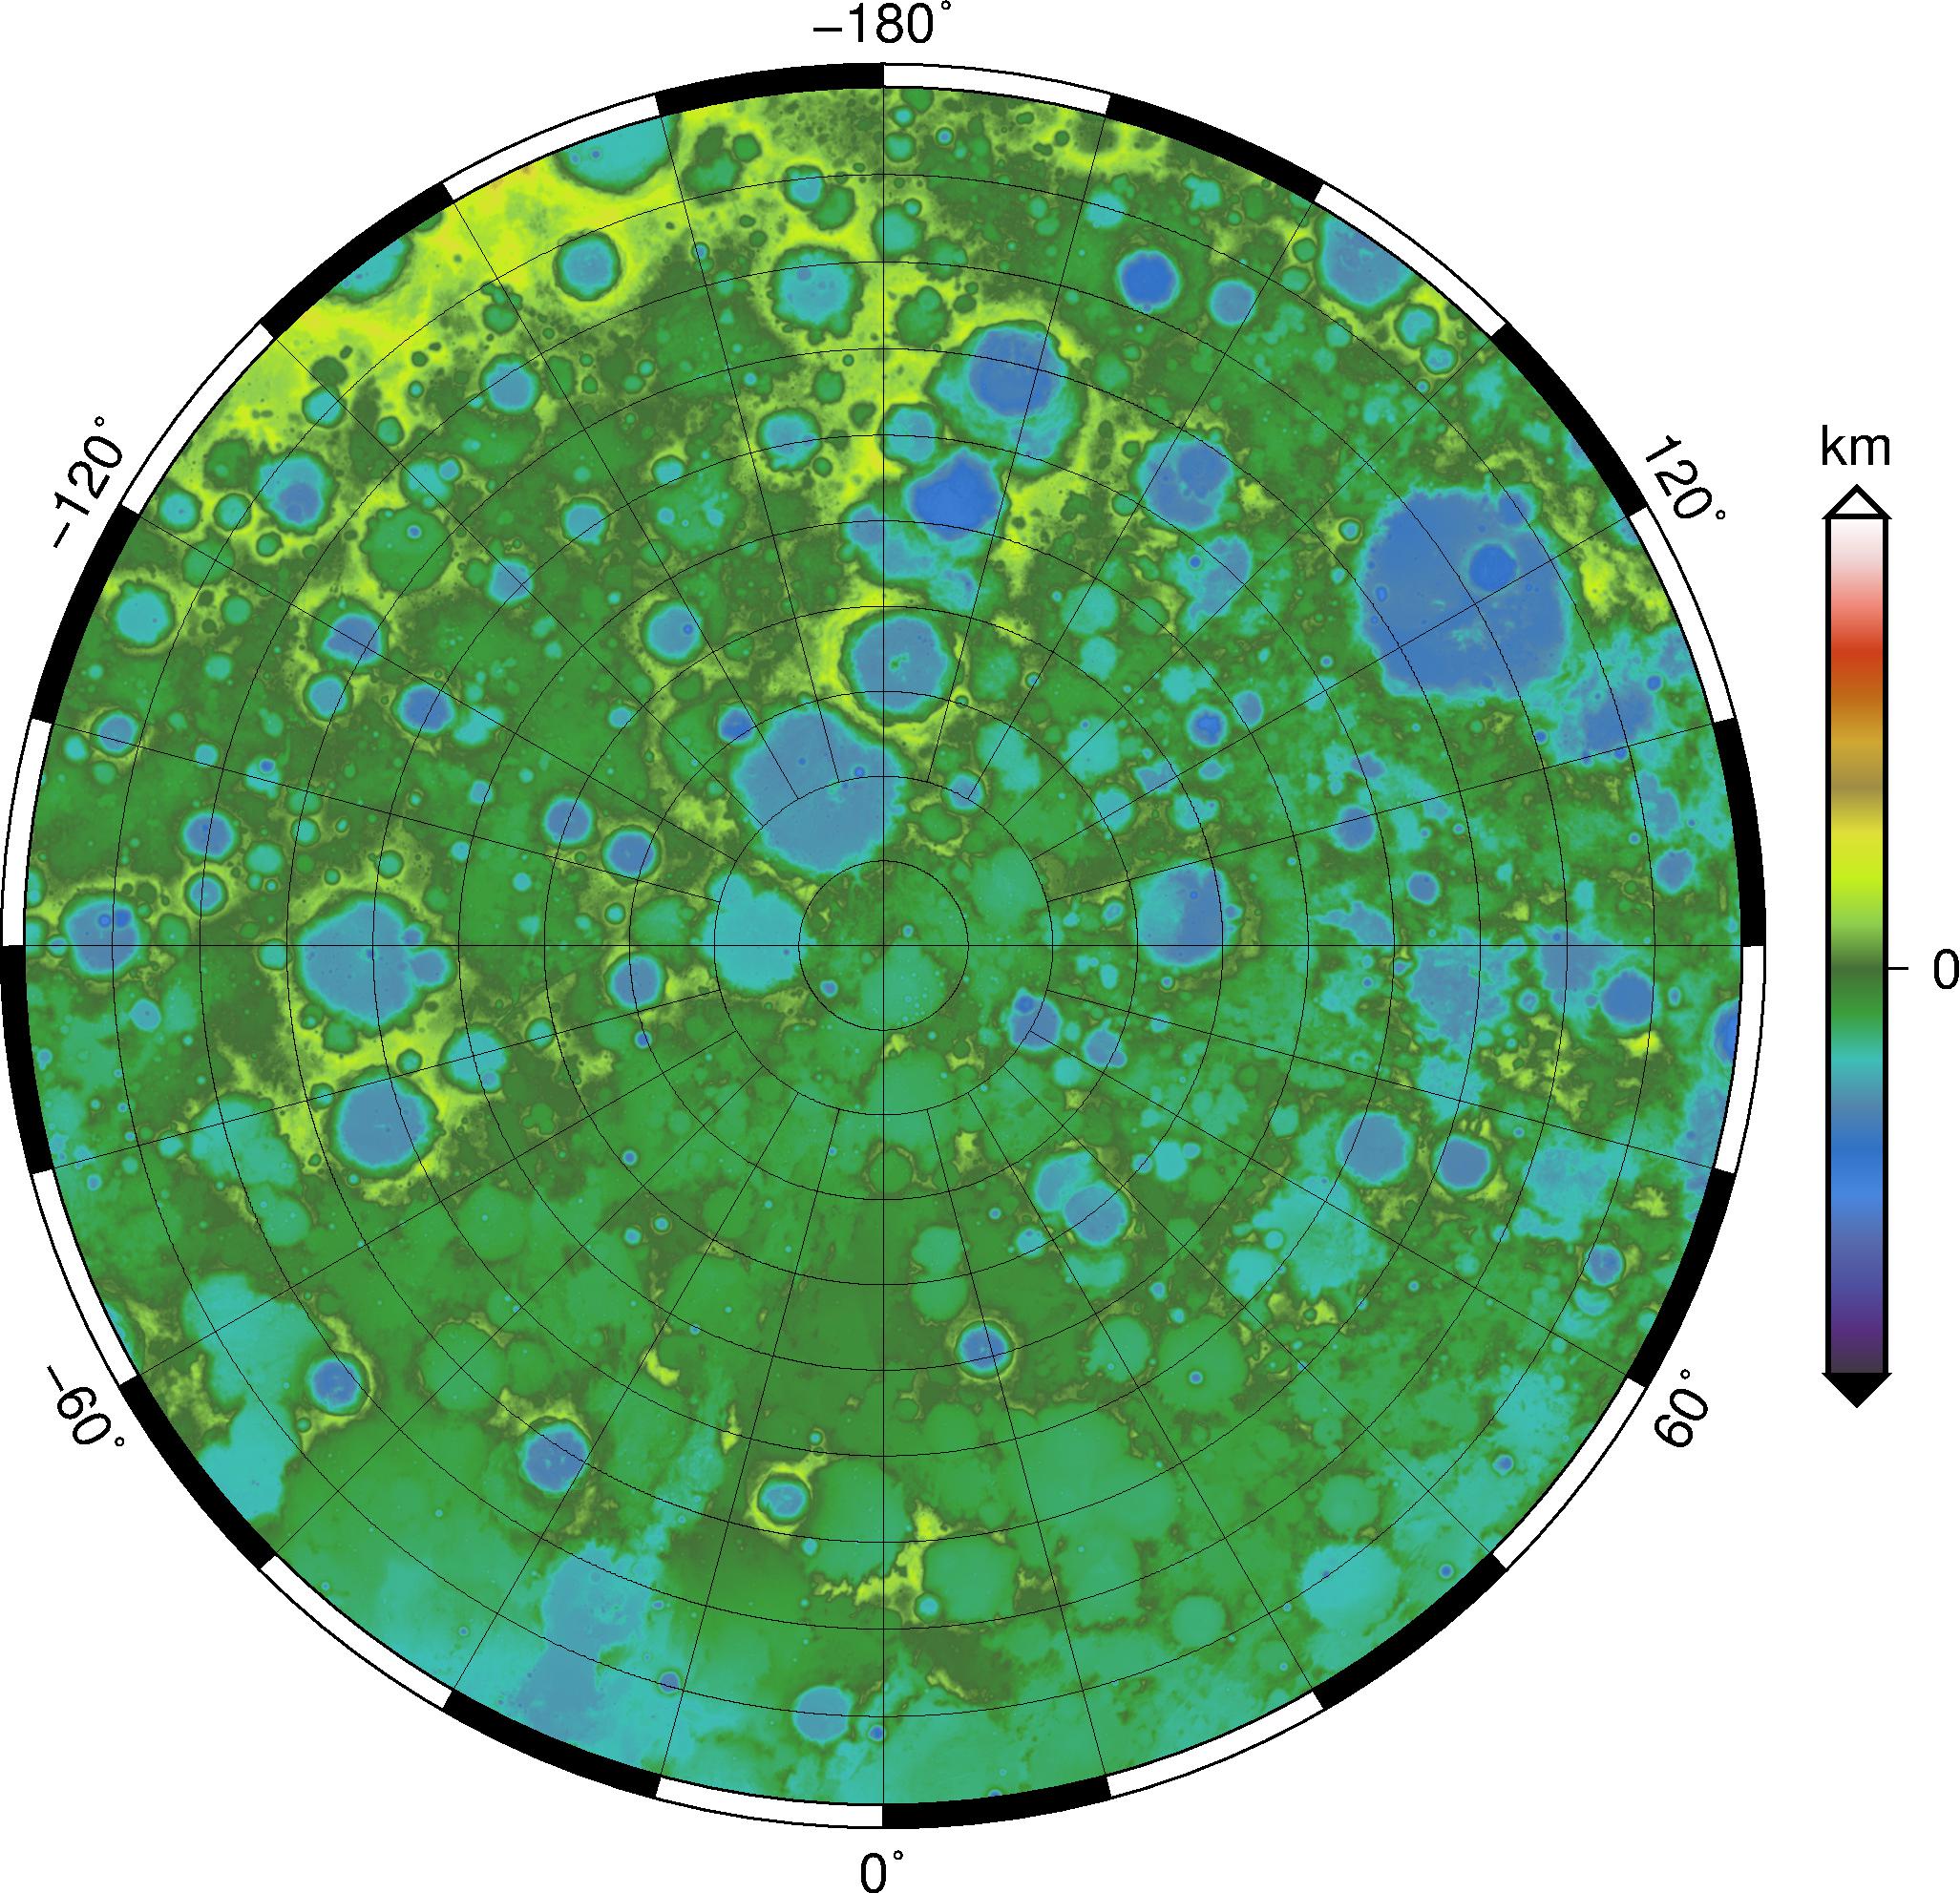
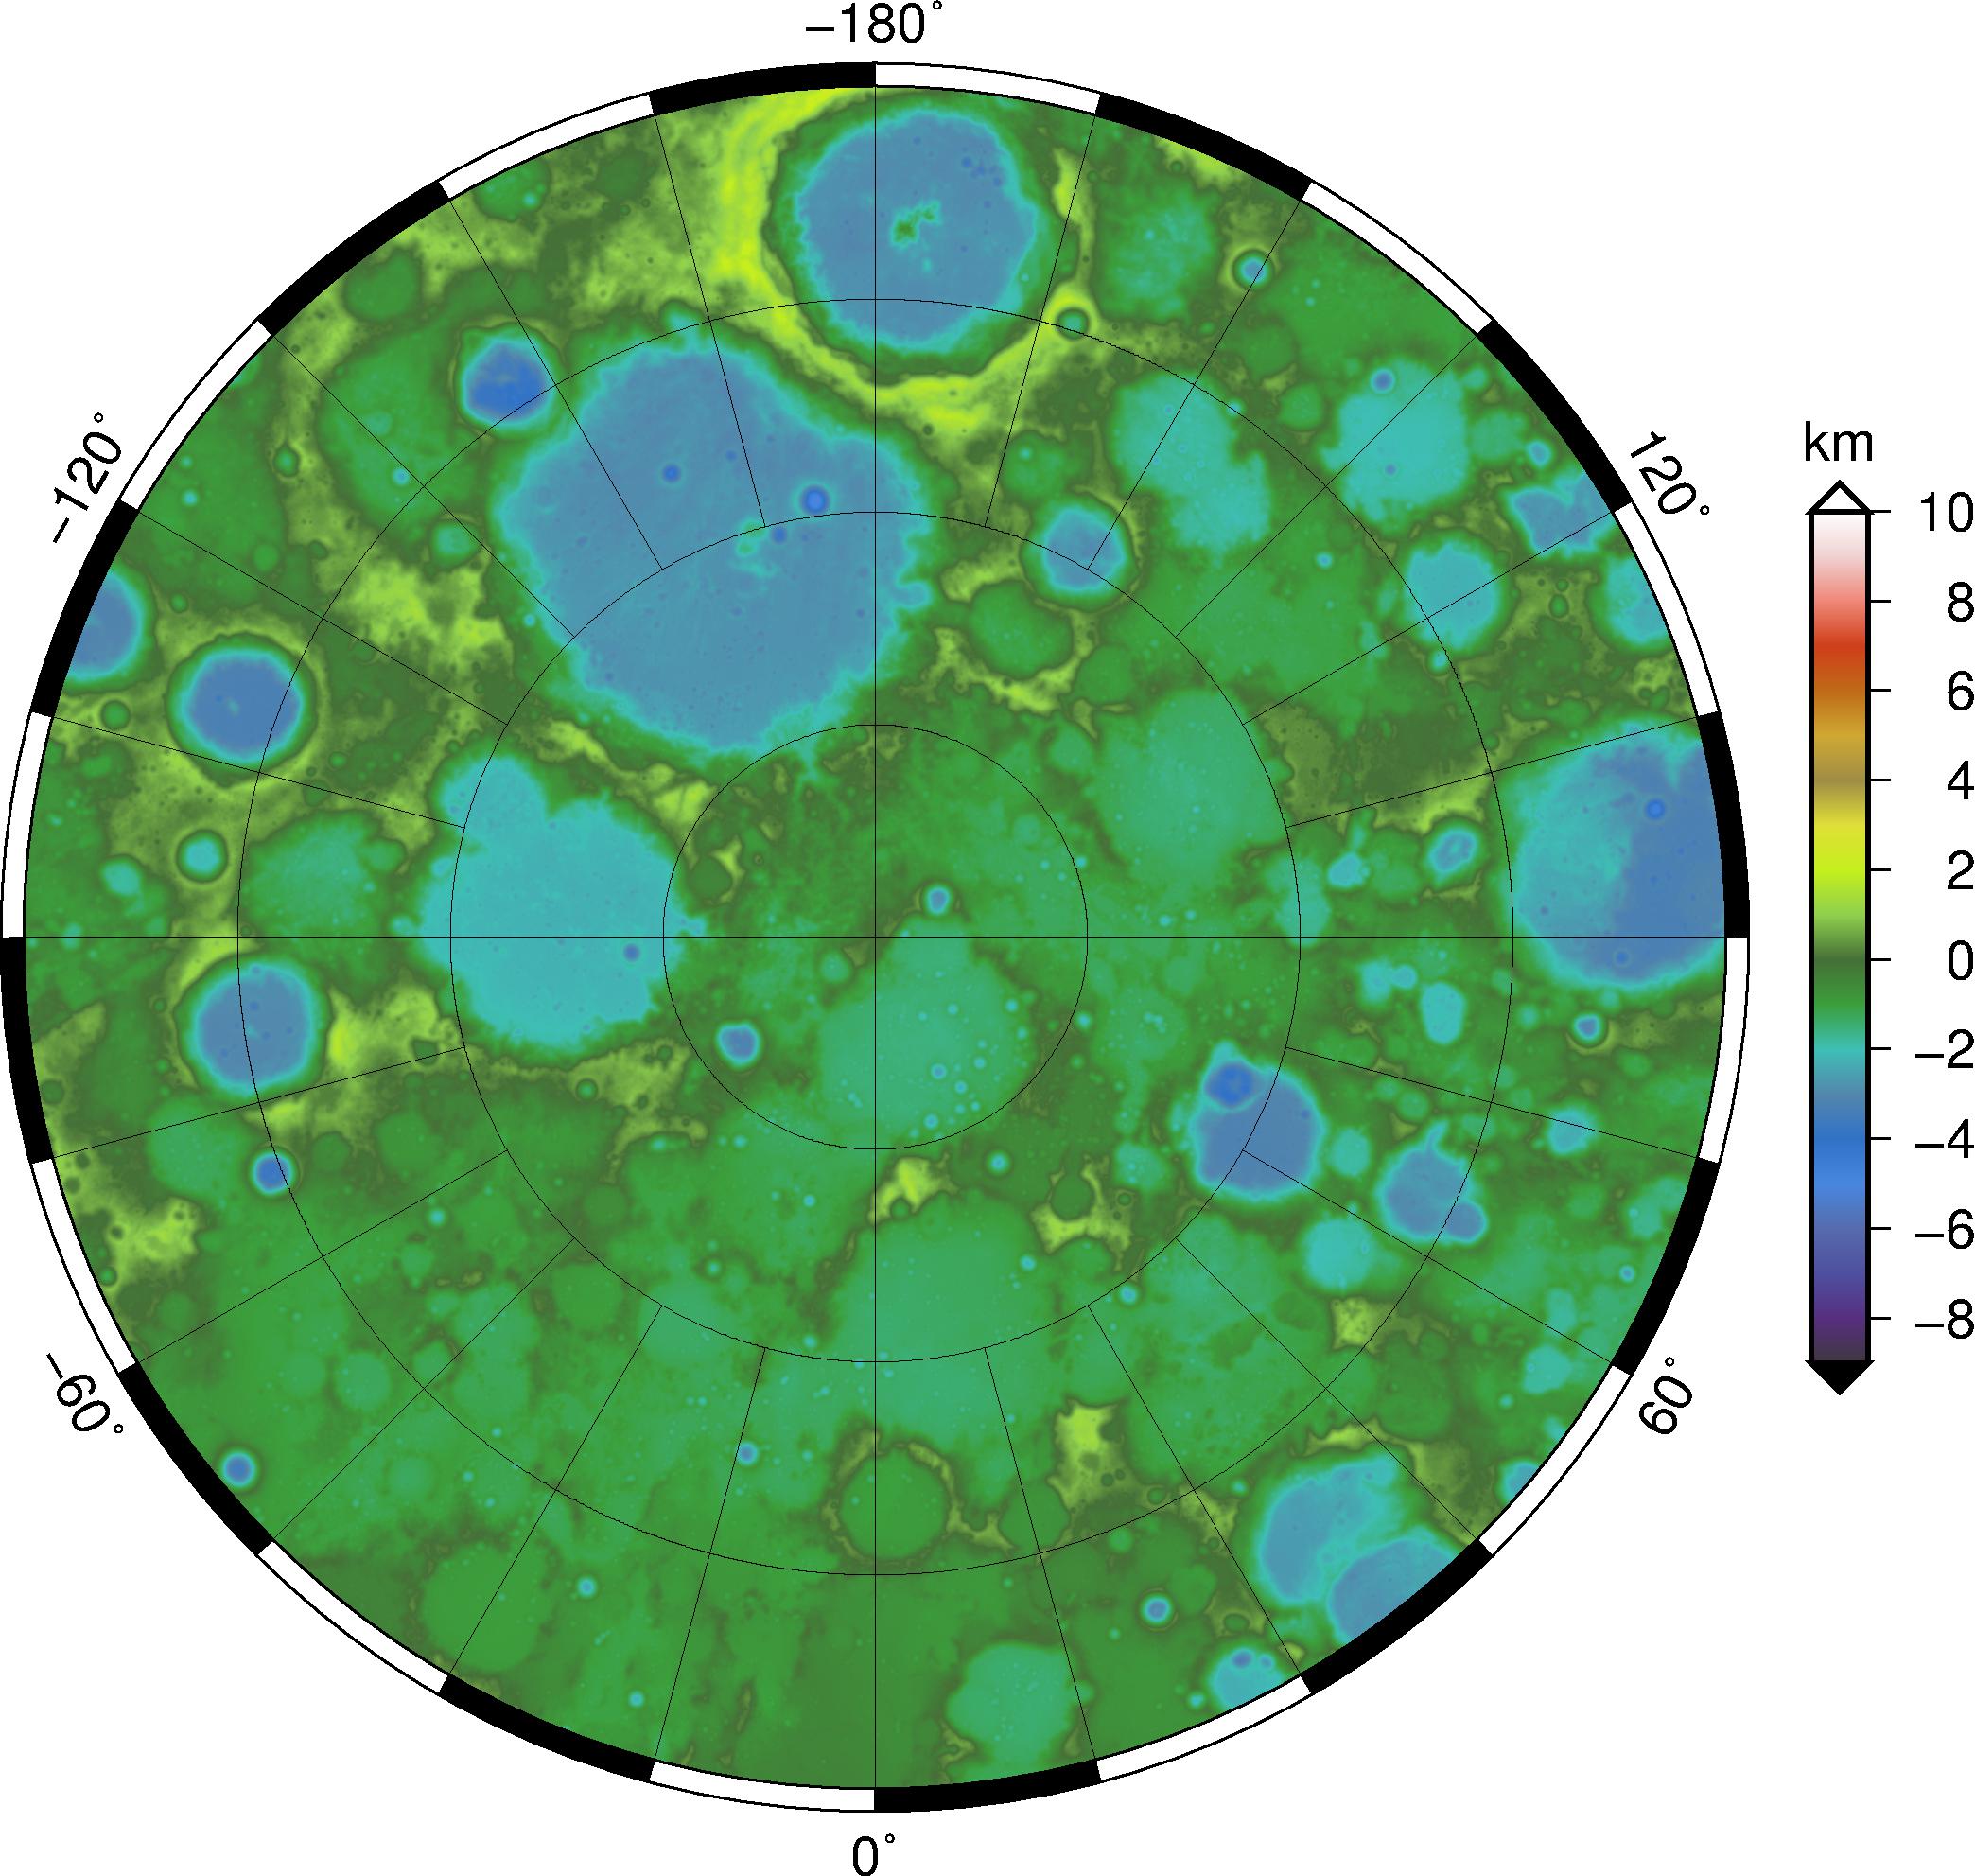
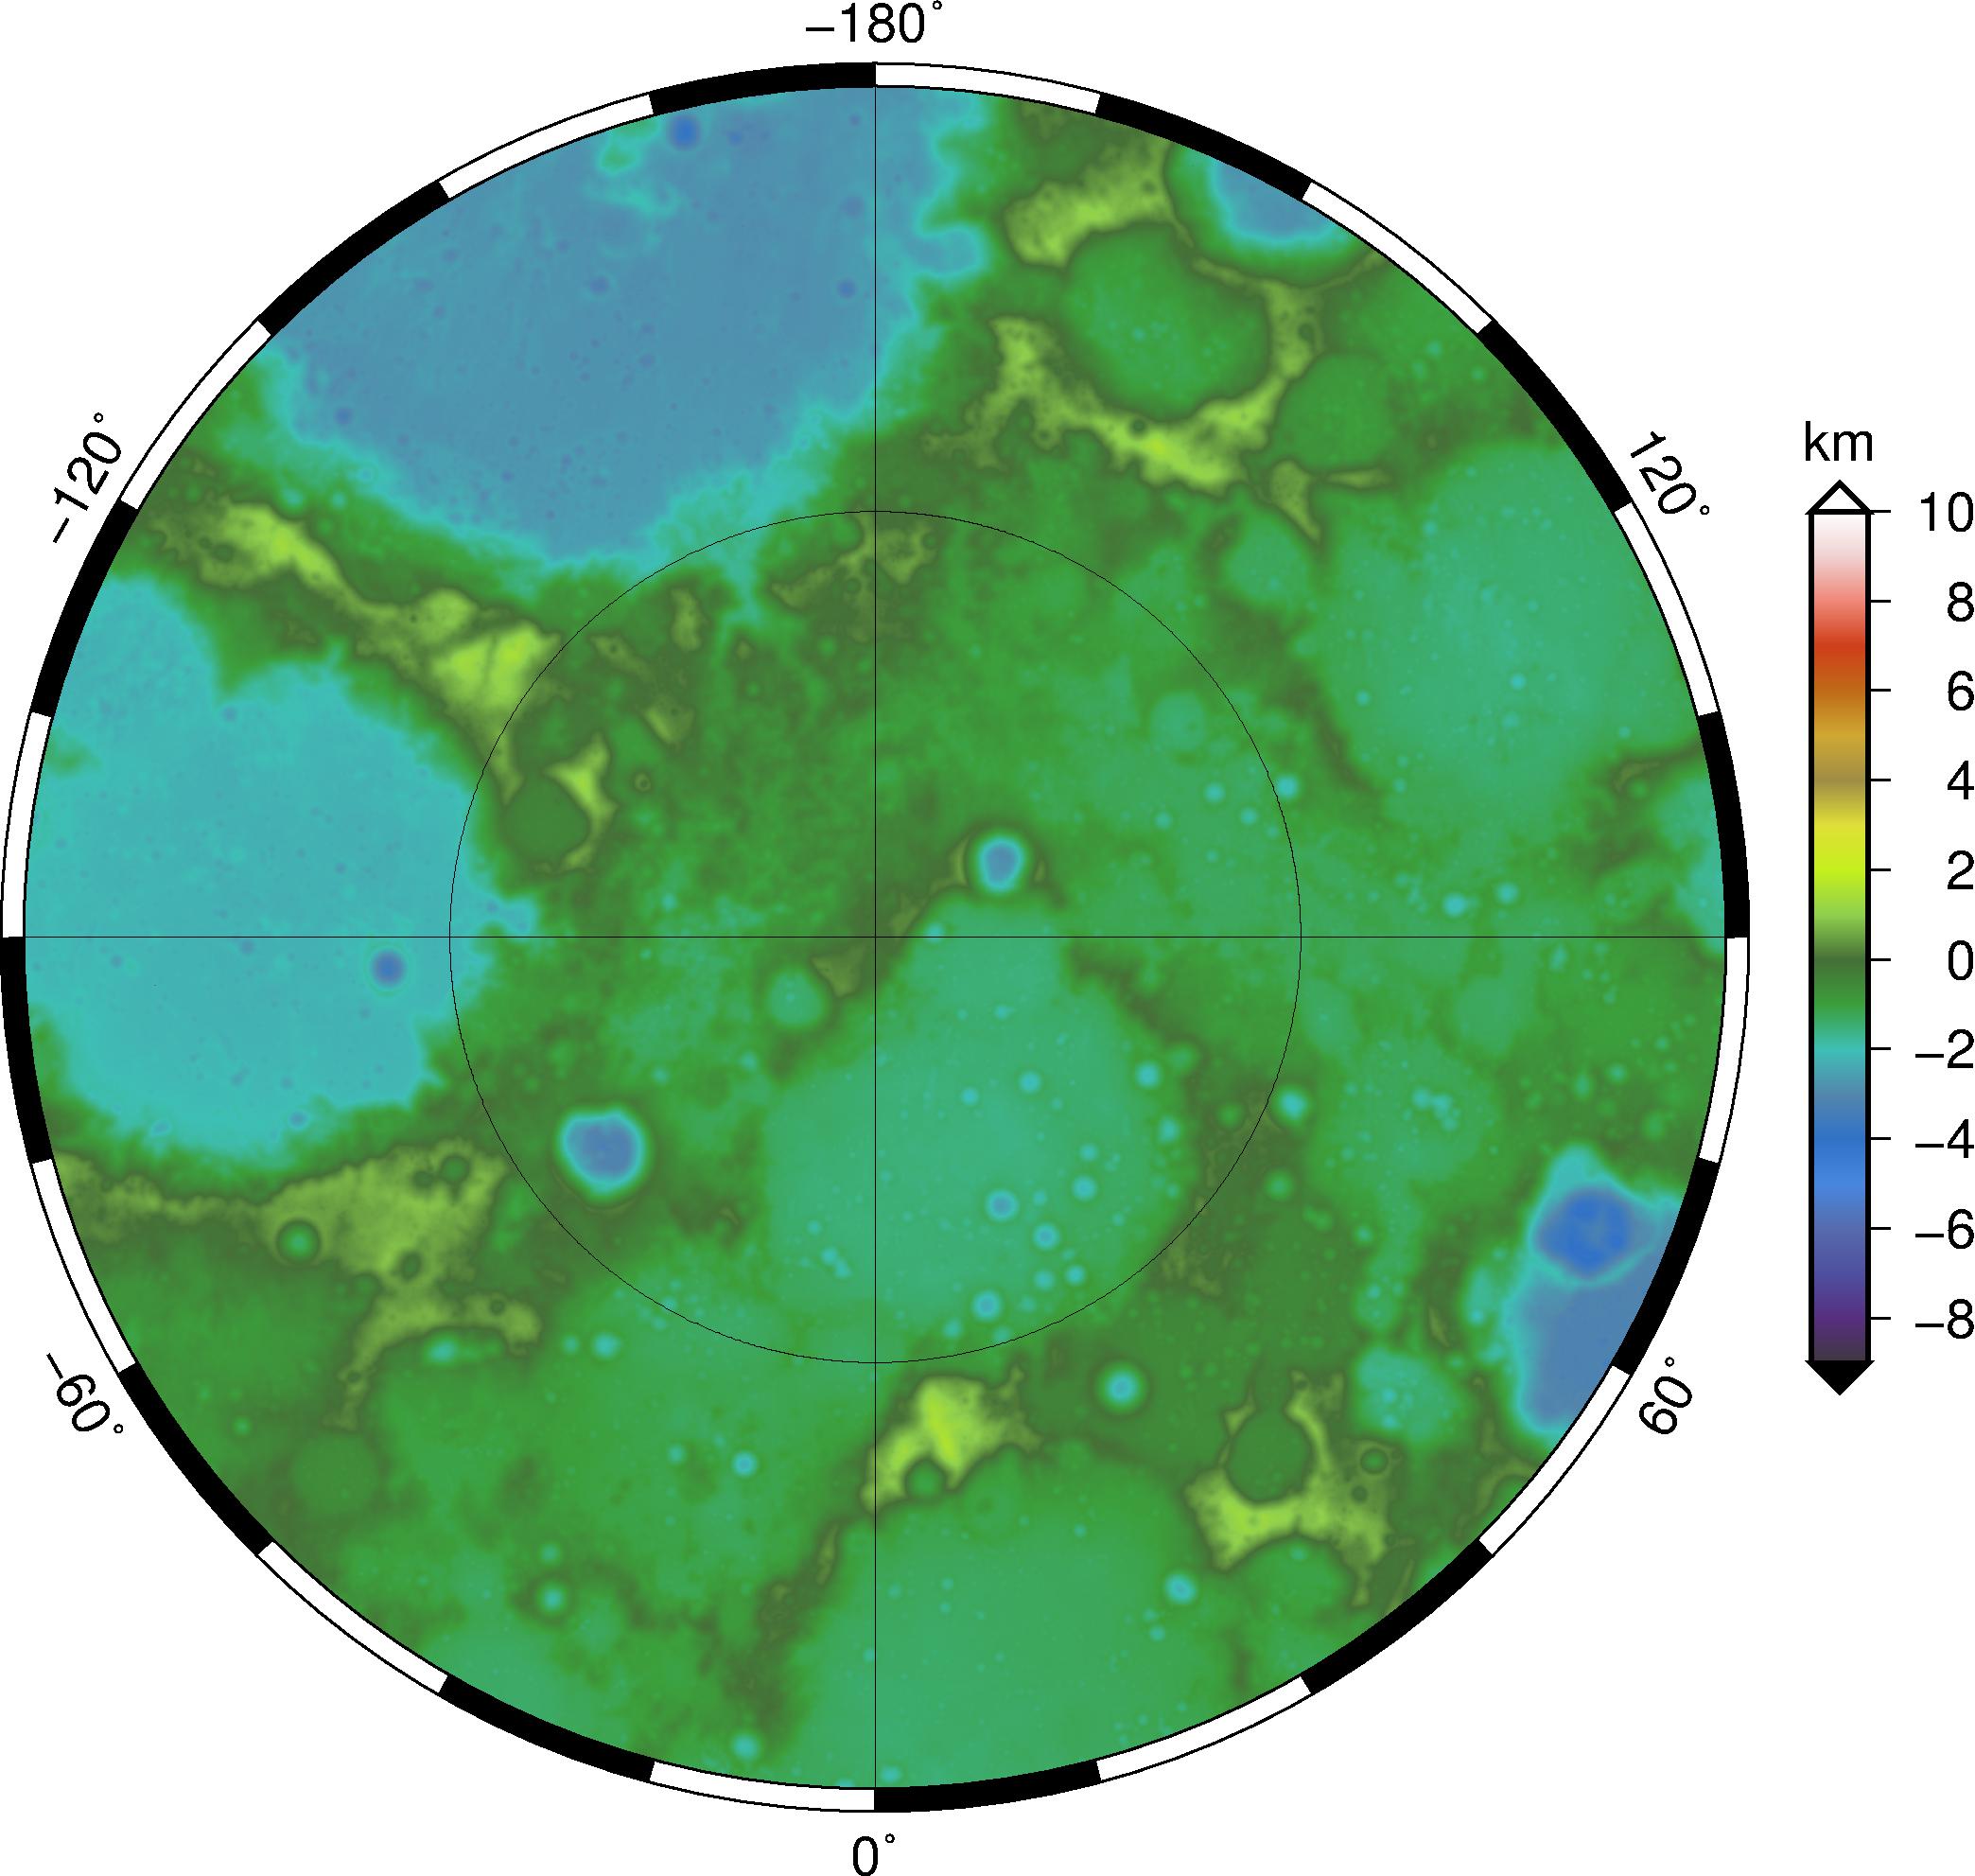
Figure 2. Elevation maps in the north polar region (referenced to a 1737.4 km sphere), in polar stereographic projection. Shown over
65N-90N (left, 240m/px), 80N-90N (center, 240m/px) and 85N-90N (center,
60m/px).
Using the high-precision, geodetically-controlled LOLA data, we can map the illumination conditions at any point and time. Many studies were conducting using various methods prior to the arrival of LRO (e.g., Bussey et al., 2005; Noda et al., 2008), but they were hampered by lower resolution and the presence of data gaps. Mazarico et al. (2011) used 240 meters-per-pixel polar maps from LOLA and computed the illumination conditions at the lunar poles over an entire lunar nutation cycle (~18.6 years) with a timestep of one hour. These results were since updated as higher-quality maps (in terms of coverage and resolution) became available.
Here, we describe the products made available by the LOLA team on the NASA Planetary Data System (PDS), and they are typically averages over long time periods. Contact us if you have specific needs (e.g., a given duration for a given site).
All the products introduced below are focused at the polar regions, and are thus created in polar stereographic projection, with a reference radius of 1737.4 km and true scale at the pole. Both the PDS IMG format (int16 binary tables) and the GeoJPEG2000 format (favored for GIS software) are used for distribution.
Solar illumination
The lunar poles can be extreme, with substantial fractions of their area in permanent shadow, and with a very few locations enjoying near-continuous sunlight. The average solar illumination computed over a lunar nutation cycle is helpful to identify such sites, although further analysis is preferable to assess the effect of shorter time periods, higher resolution, and height above the surface (for potential rovers or habitats).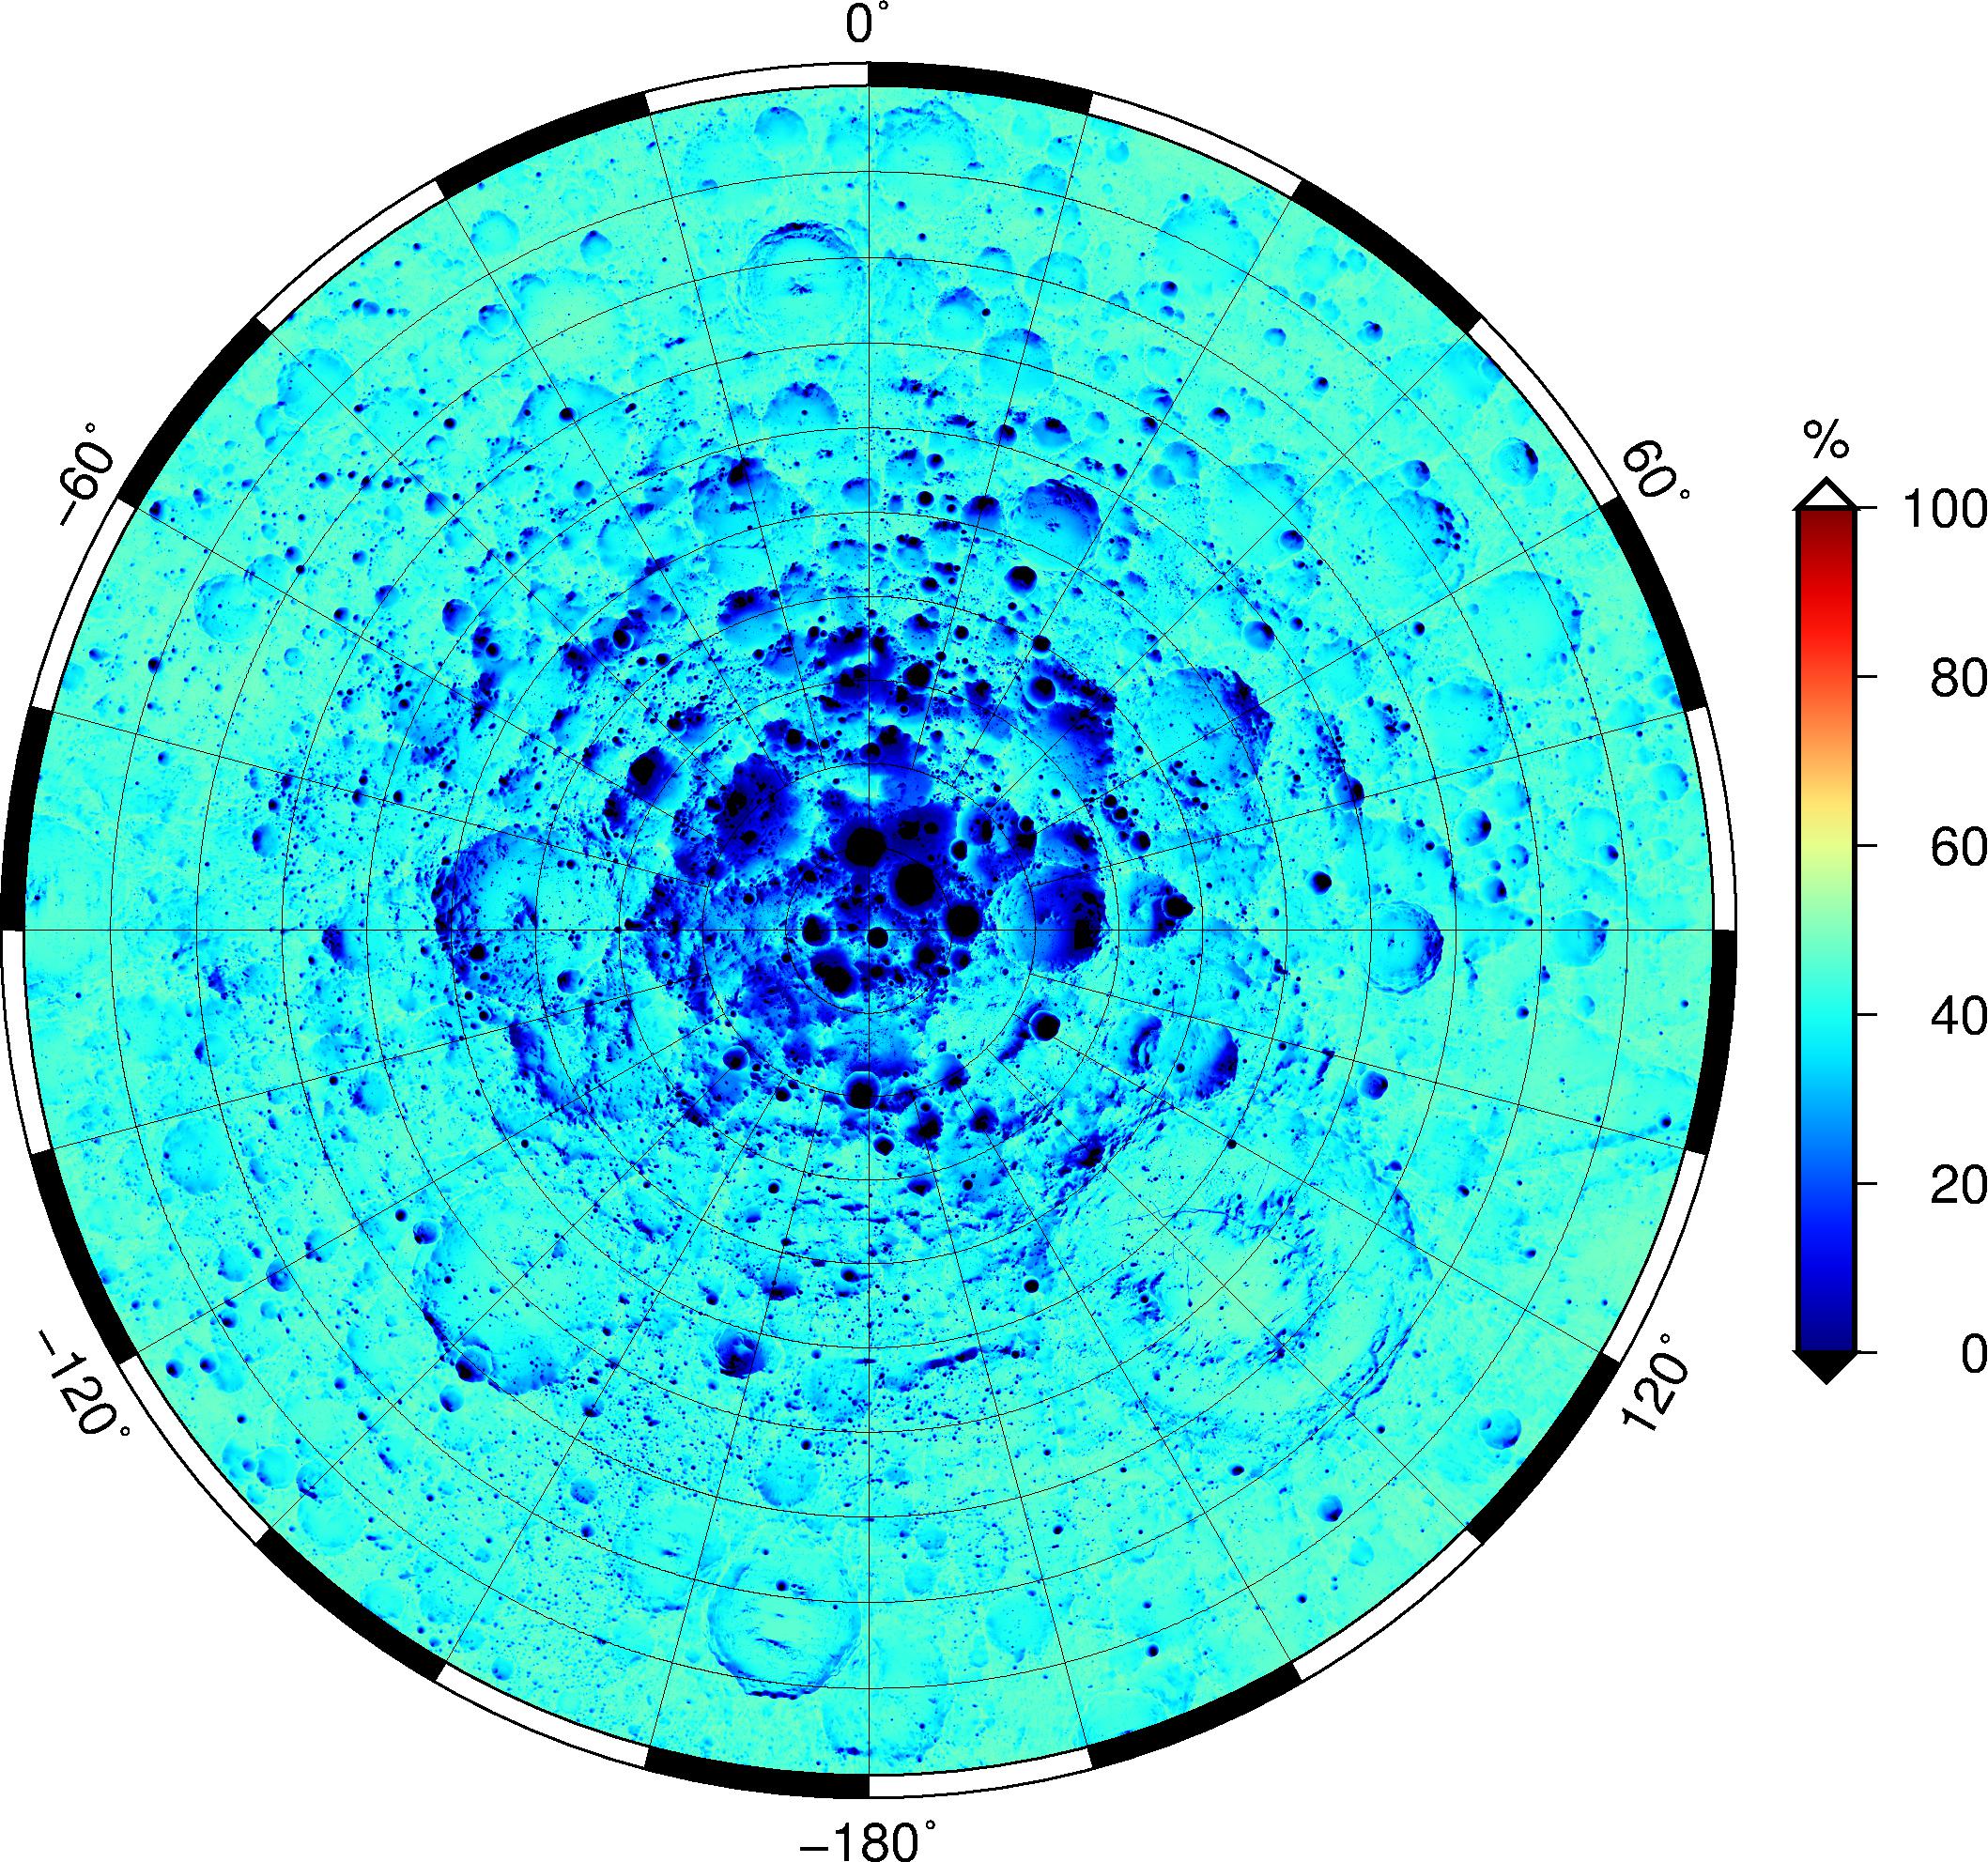
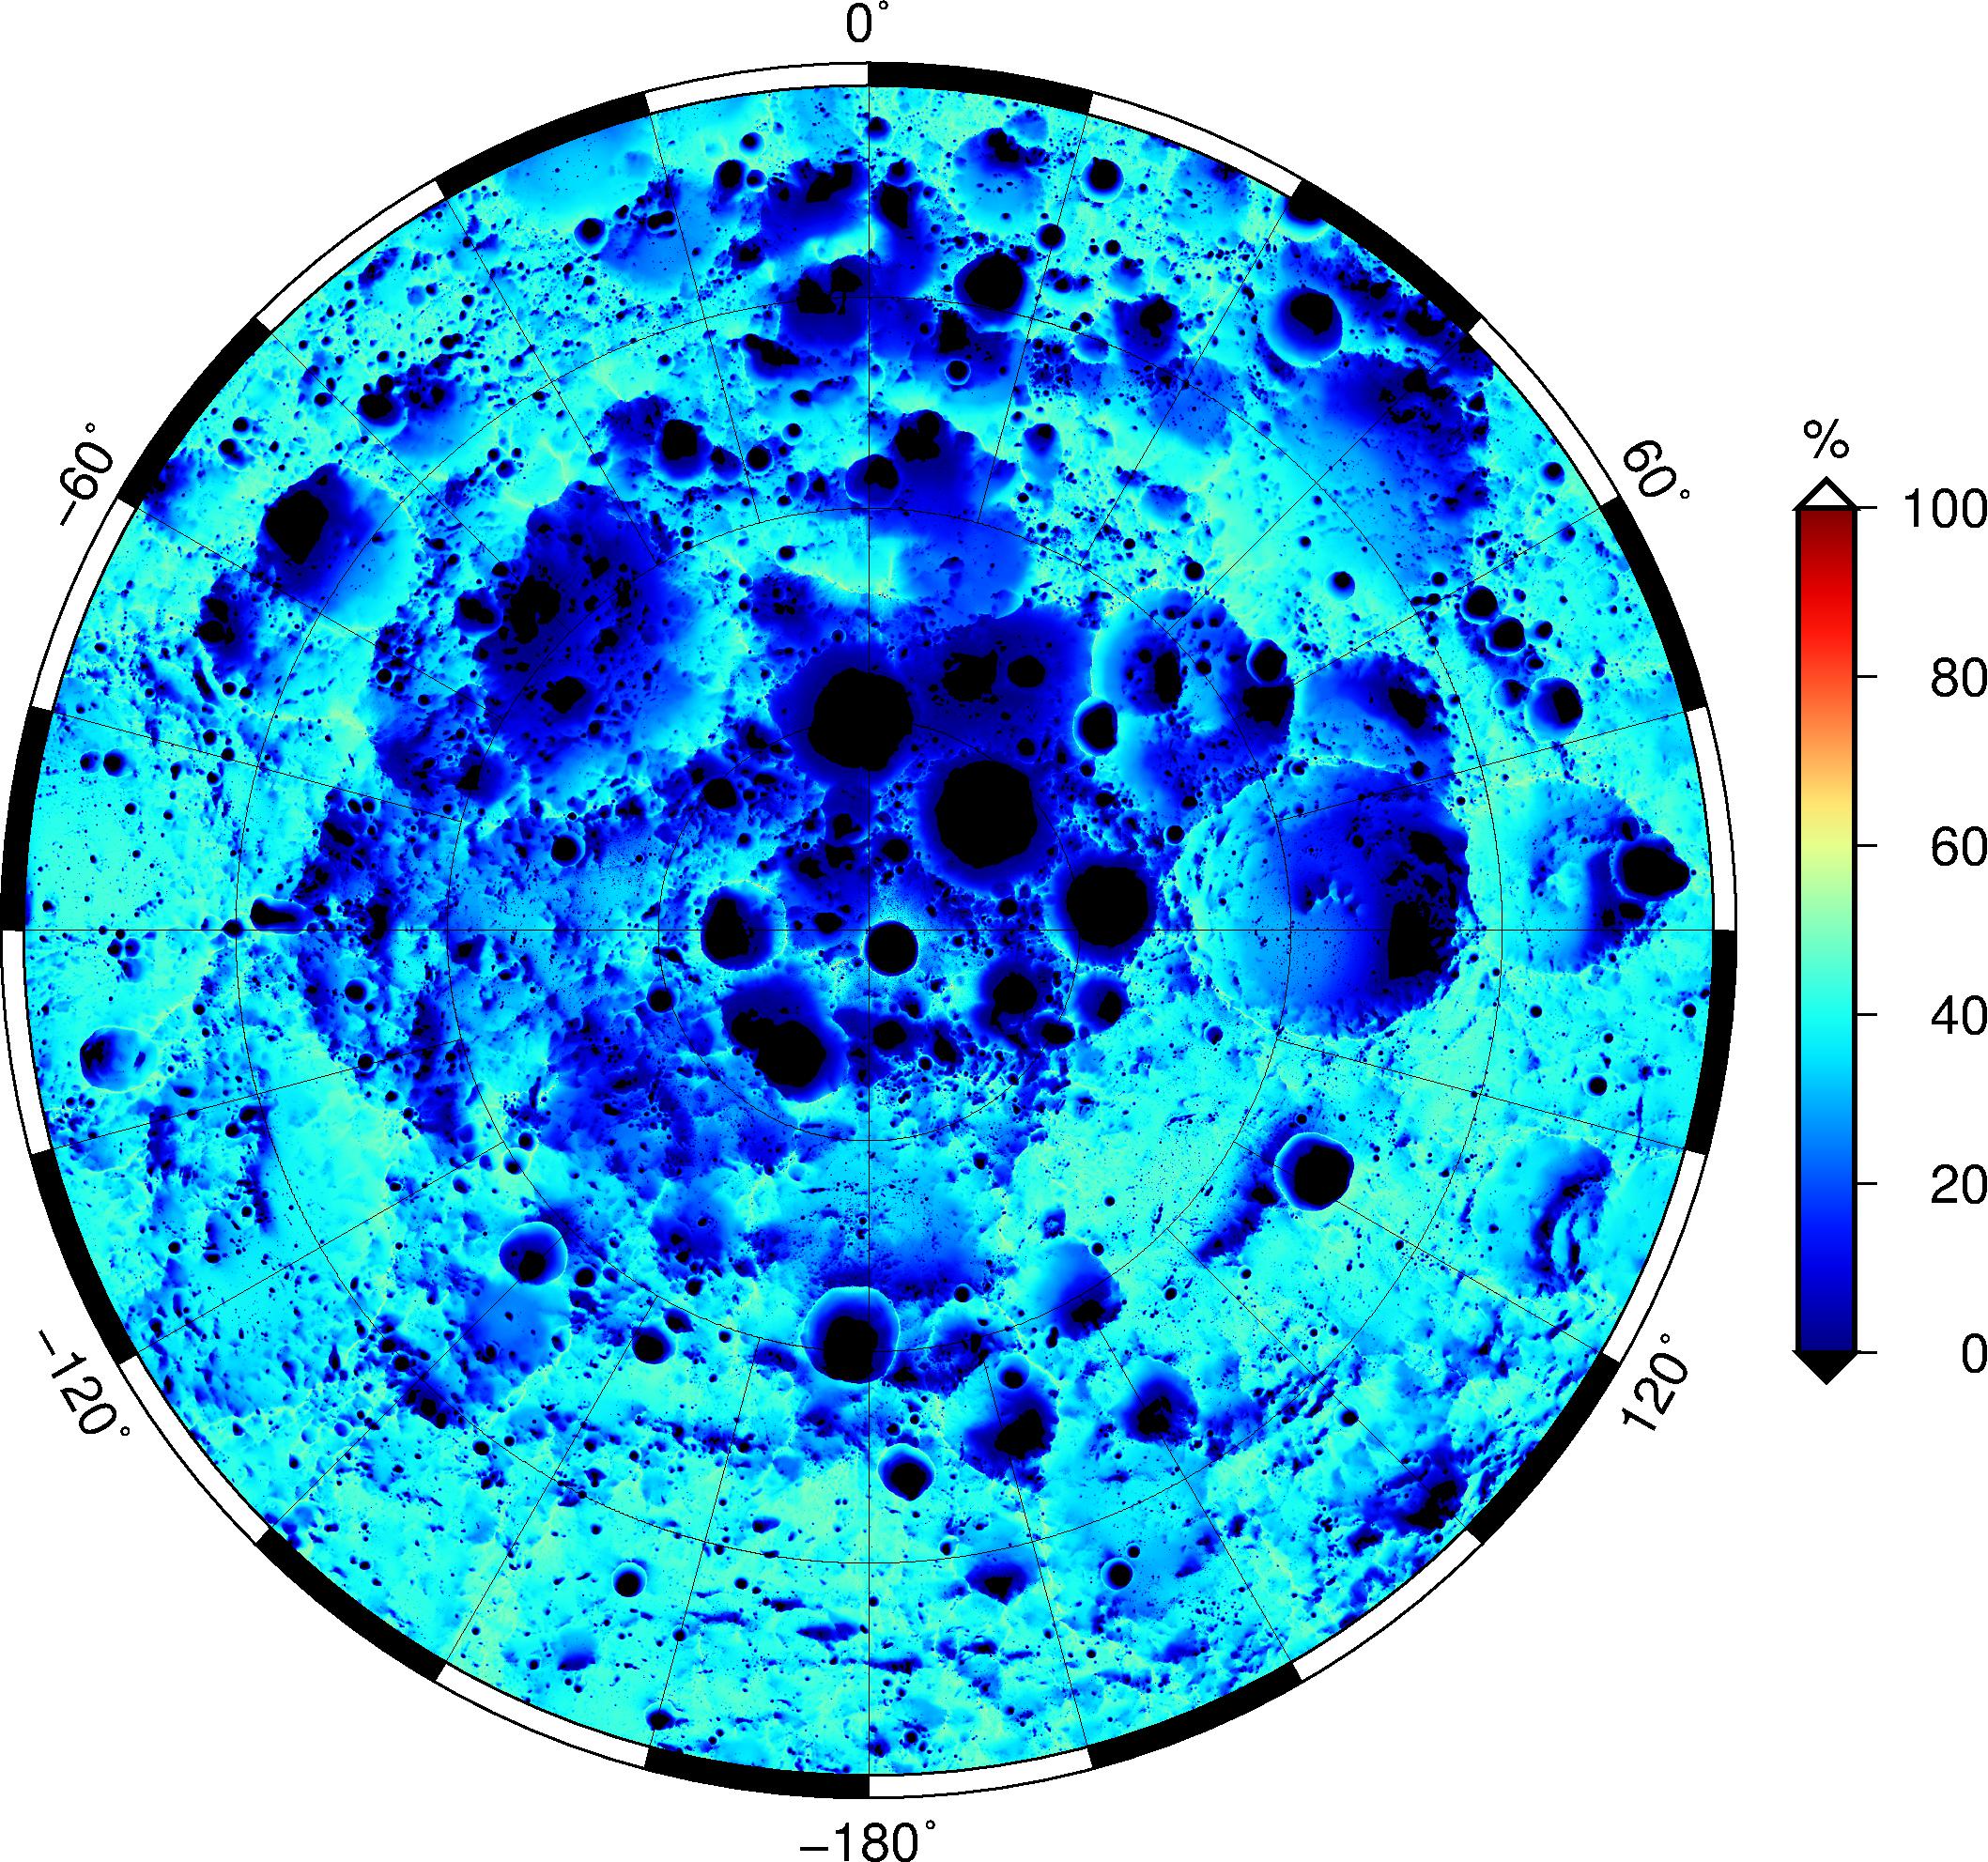
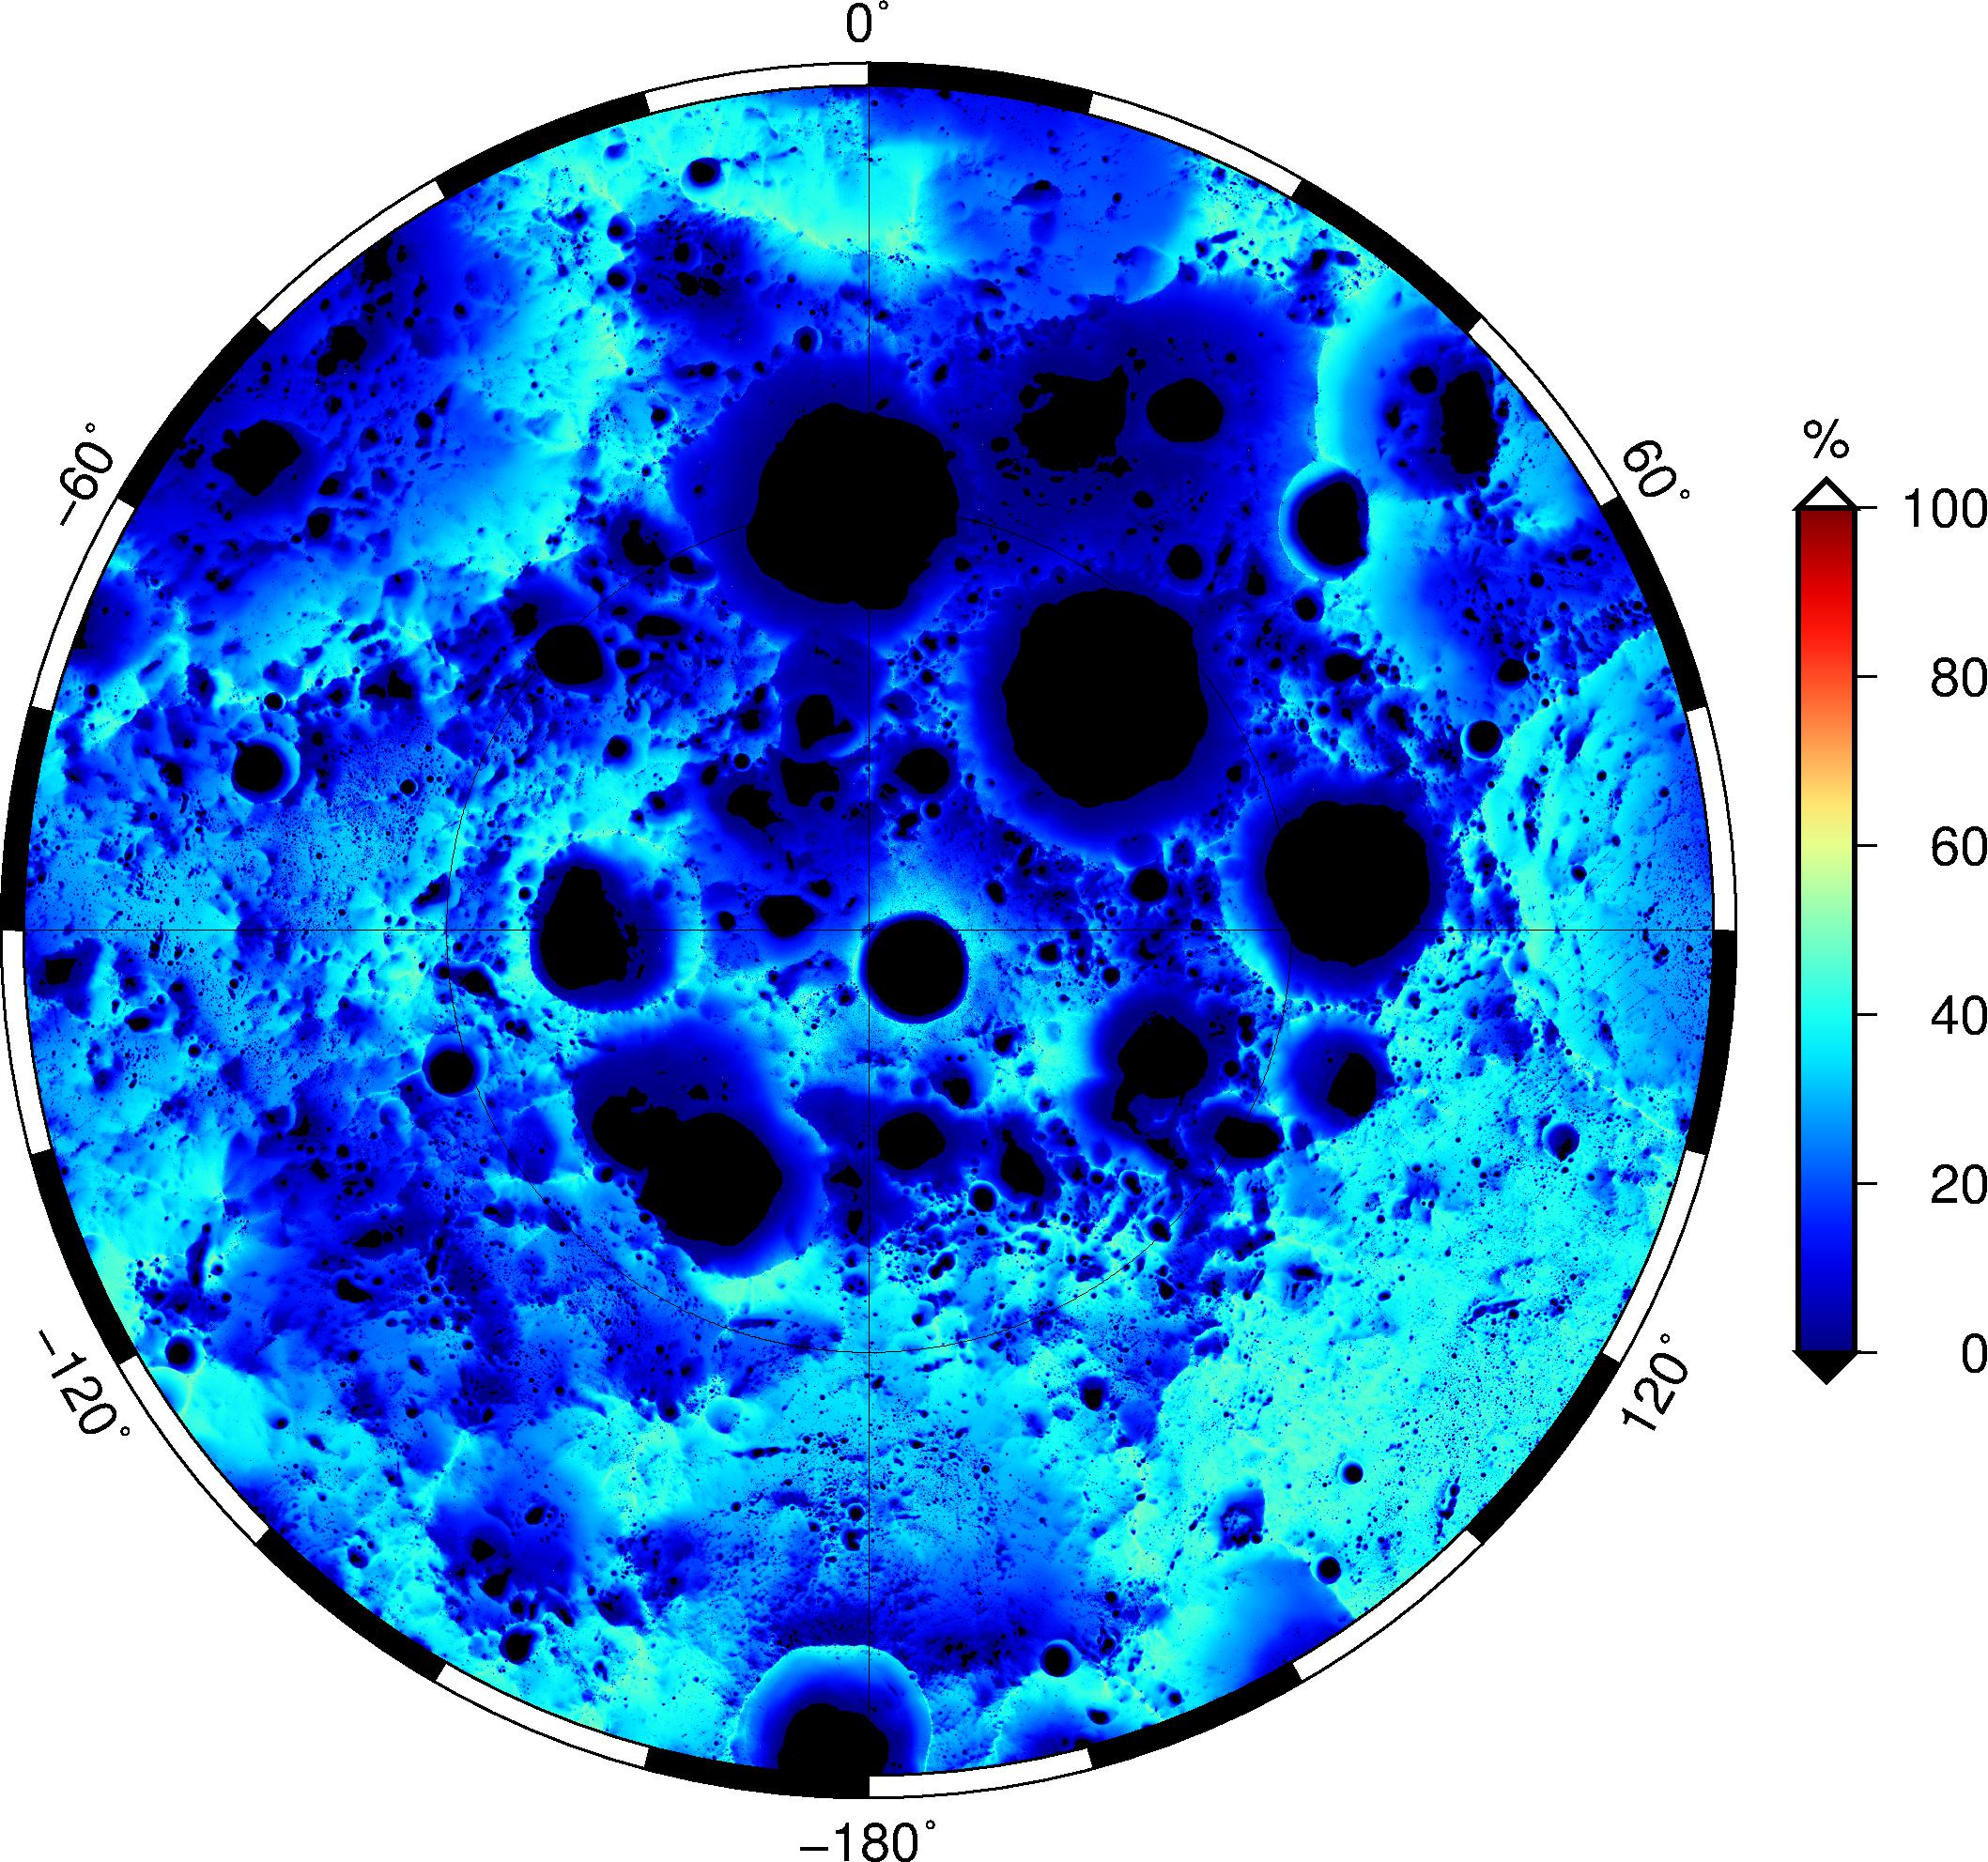
Figure 3. Maps of the solar illumination, averaged over hourly timesteps spanning 18.6 years, for the south polar region. Shown over 65S-90S (left, 240m/px), 80S-90S (center, 240m/px) and 85S-90S (center, 60m/px).
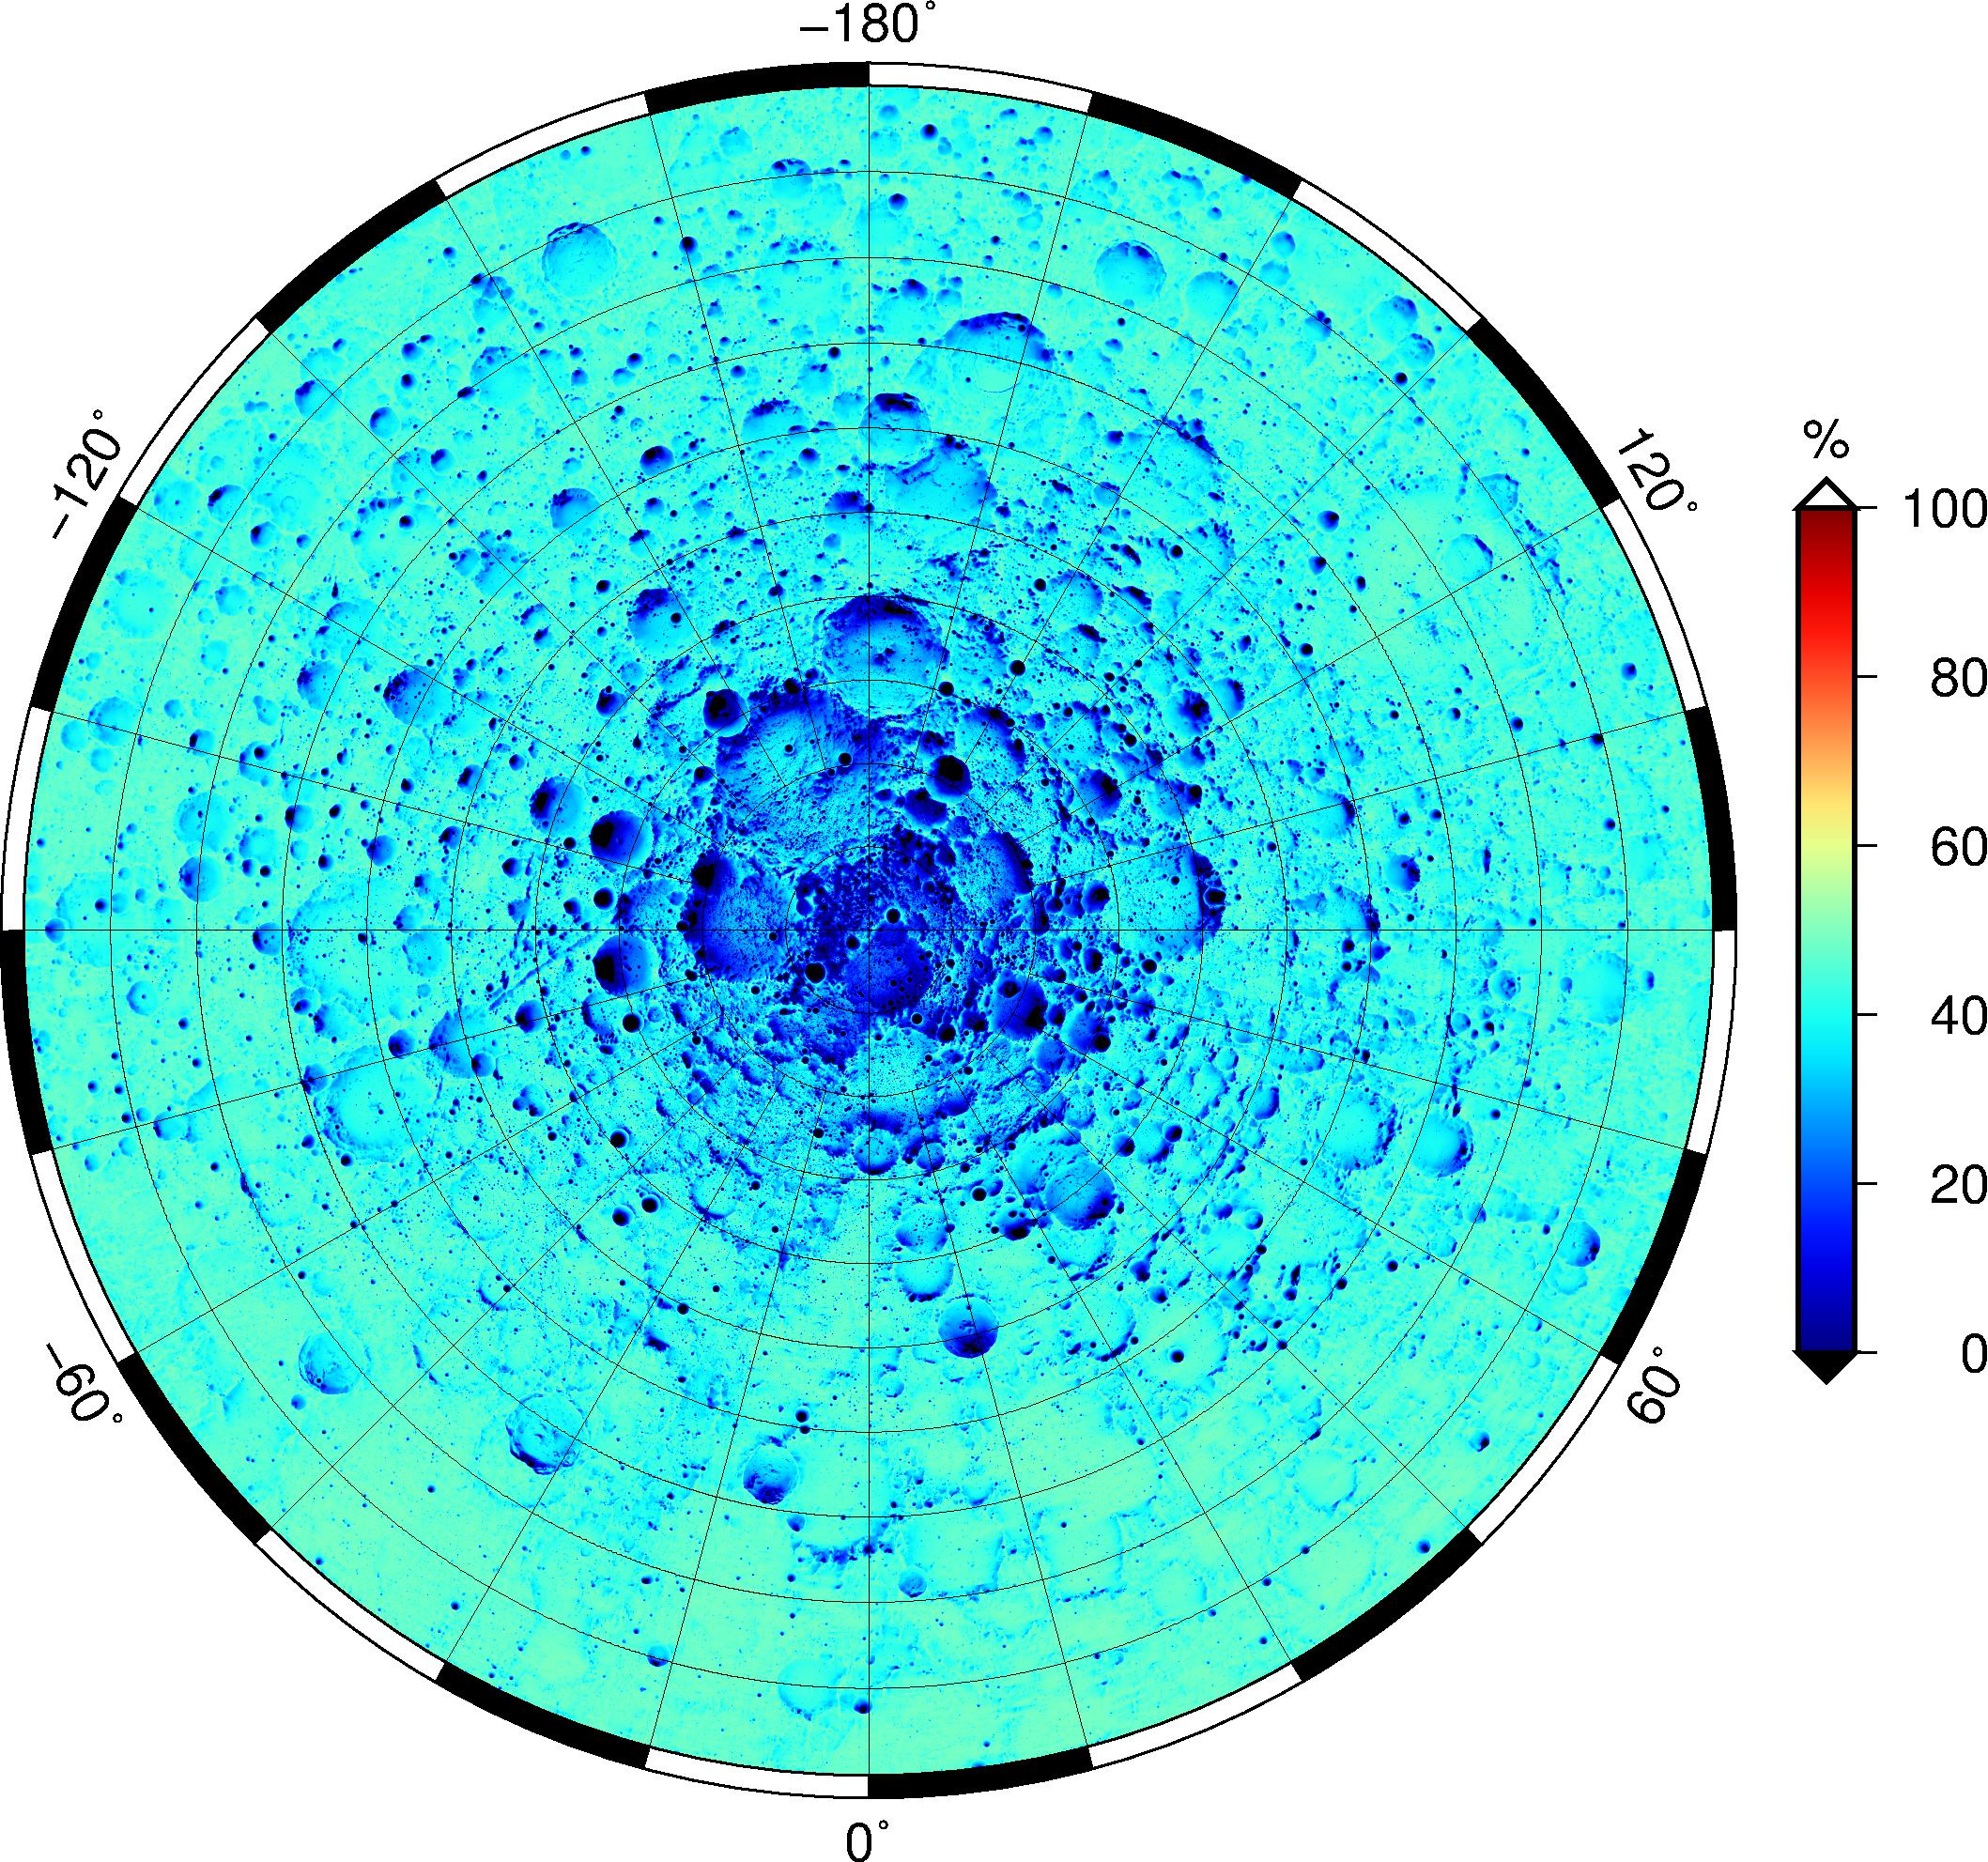
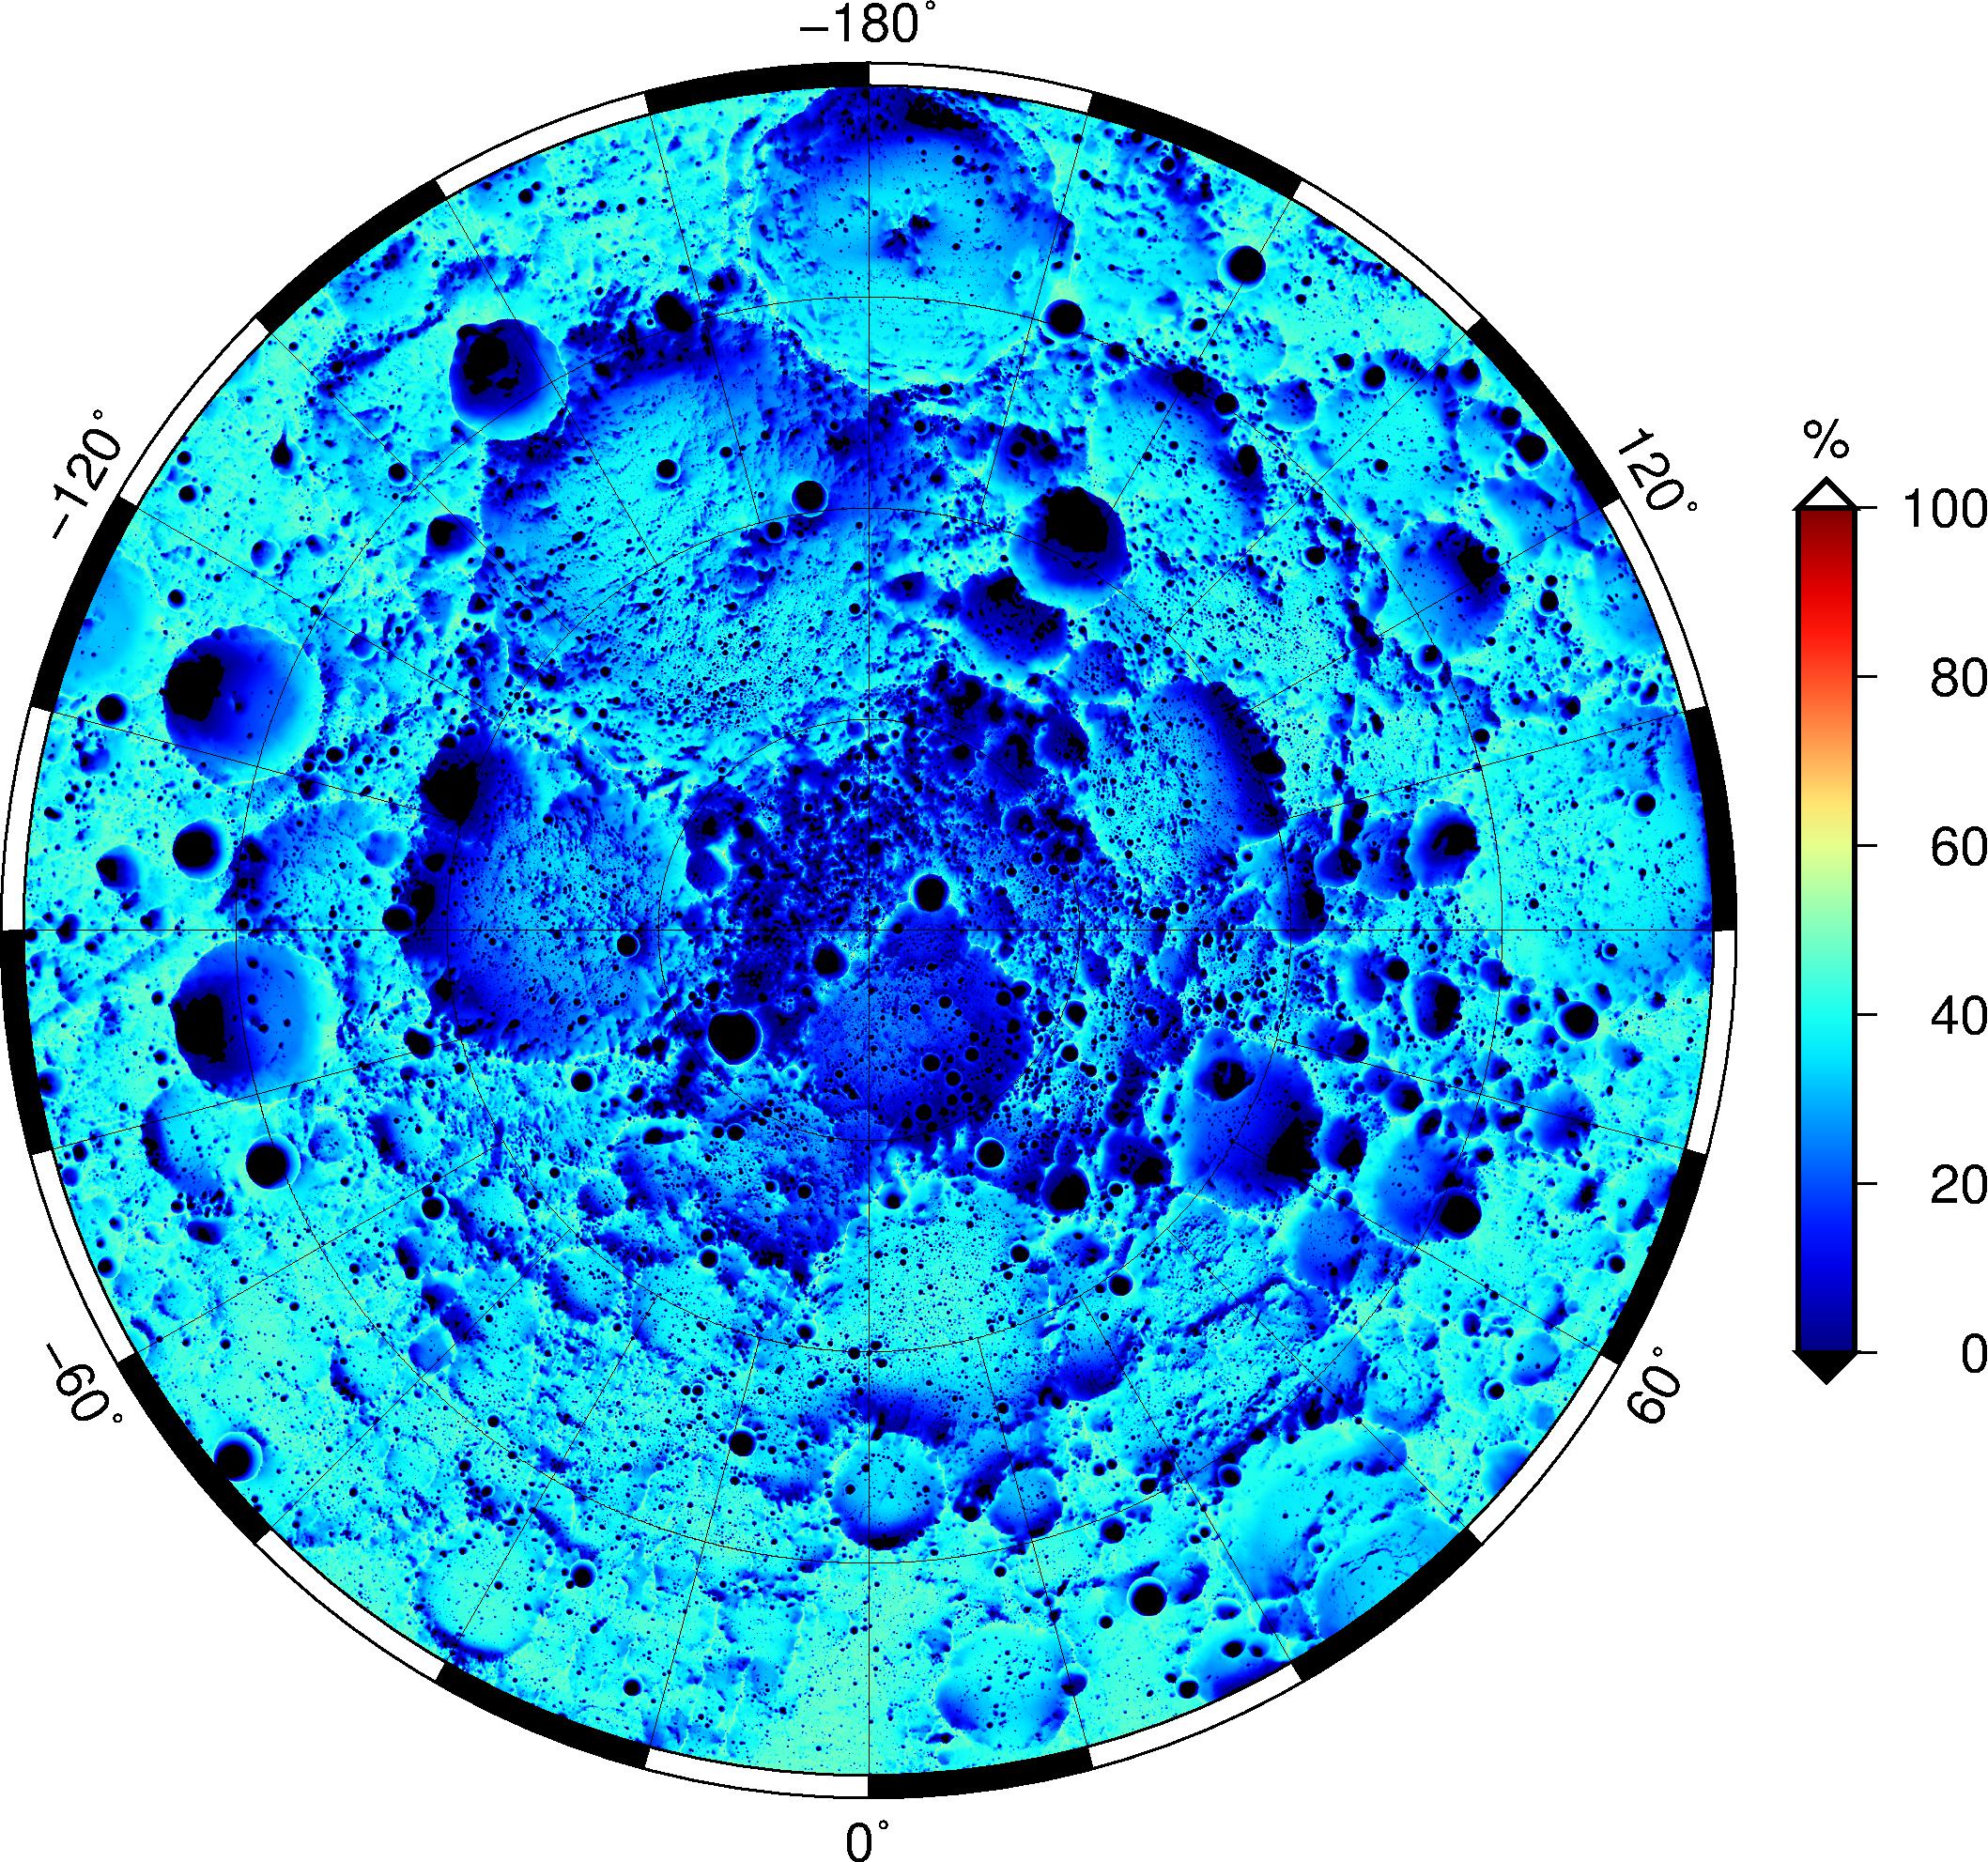
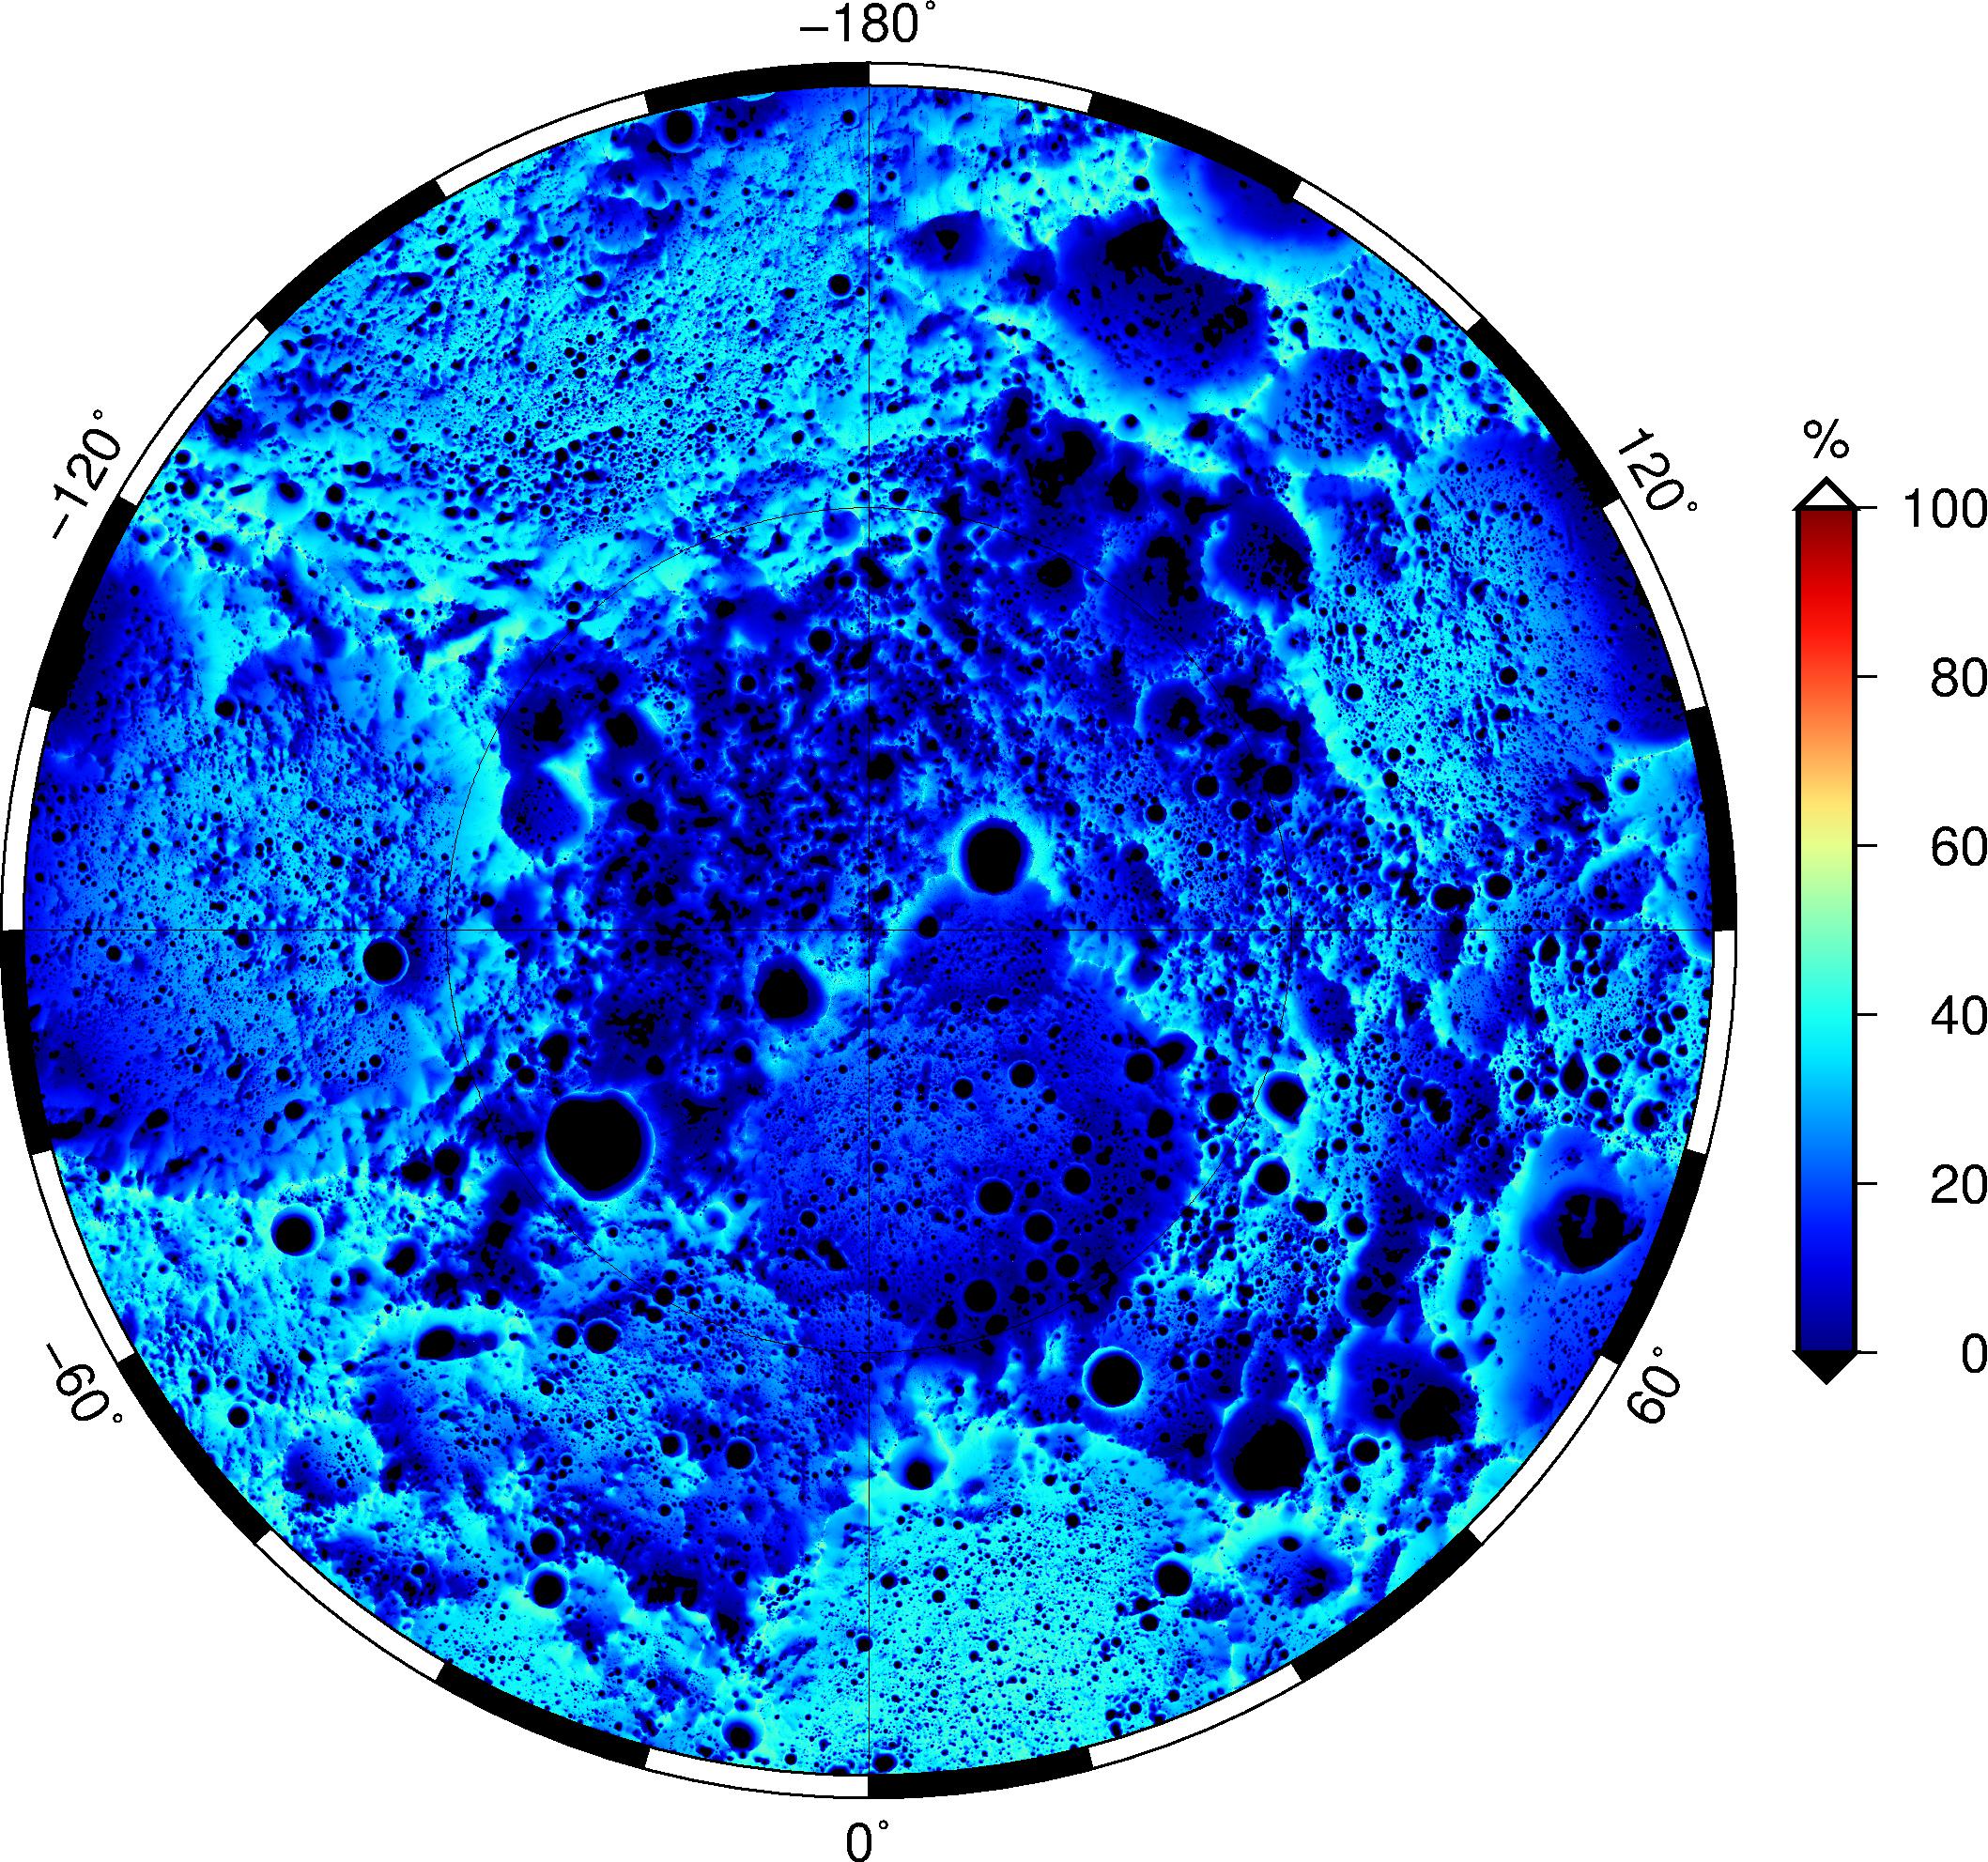
Figure 4. Maps of the solar illumination, averaged over hourly timesteps spanning 18.6 years, for the north polar region. Shown over 65N-90N (left, 240m/px), 80N-90N (center, 240m/px) and 85N-90N (center, 60m/px).
Earth visibility
Because our light source is not a point but rather a finite disc, it is very simple to change its position and size to study the visibility of the Earth from the lunar poles rather than the solar input. Such maps of Earth visibility are most useful for mission planning considerations, as landing sites or traverse planning may require direct radio contact. Note that in these calculations, the Earth is considered visible if any part of its disc is not obscured, so it may be very slightly optimistic for radio link studies that would involve only DSN stations for example.

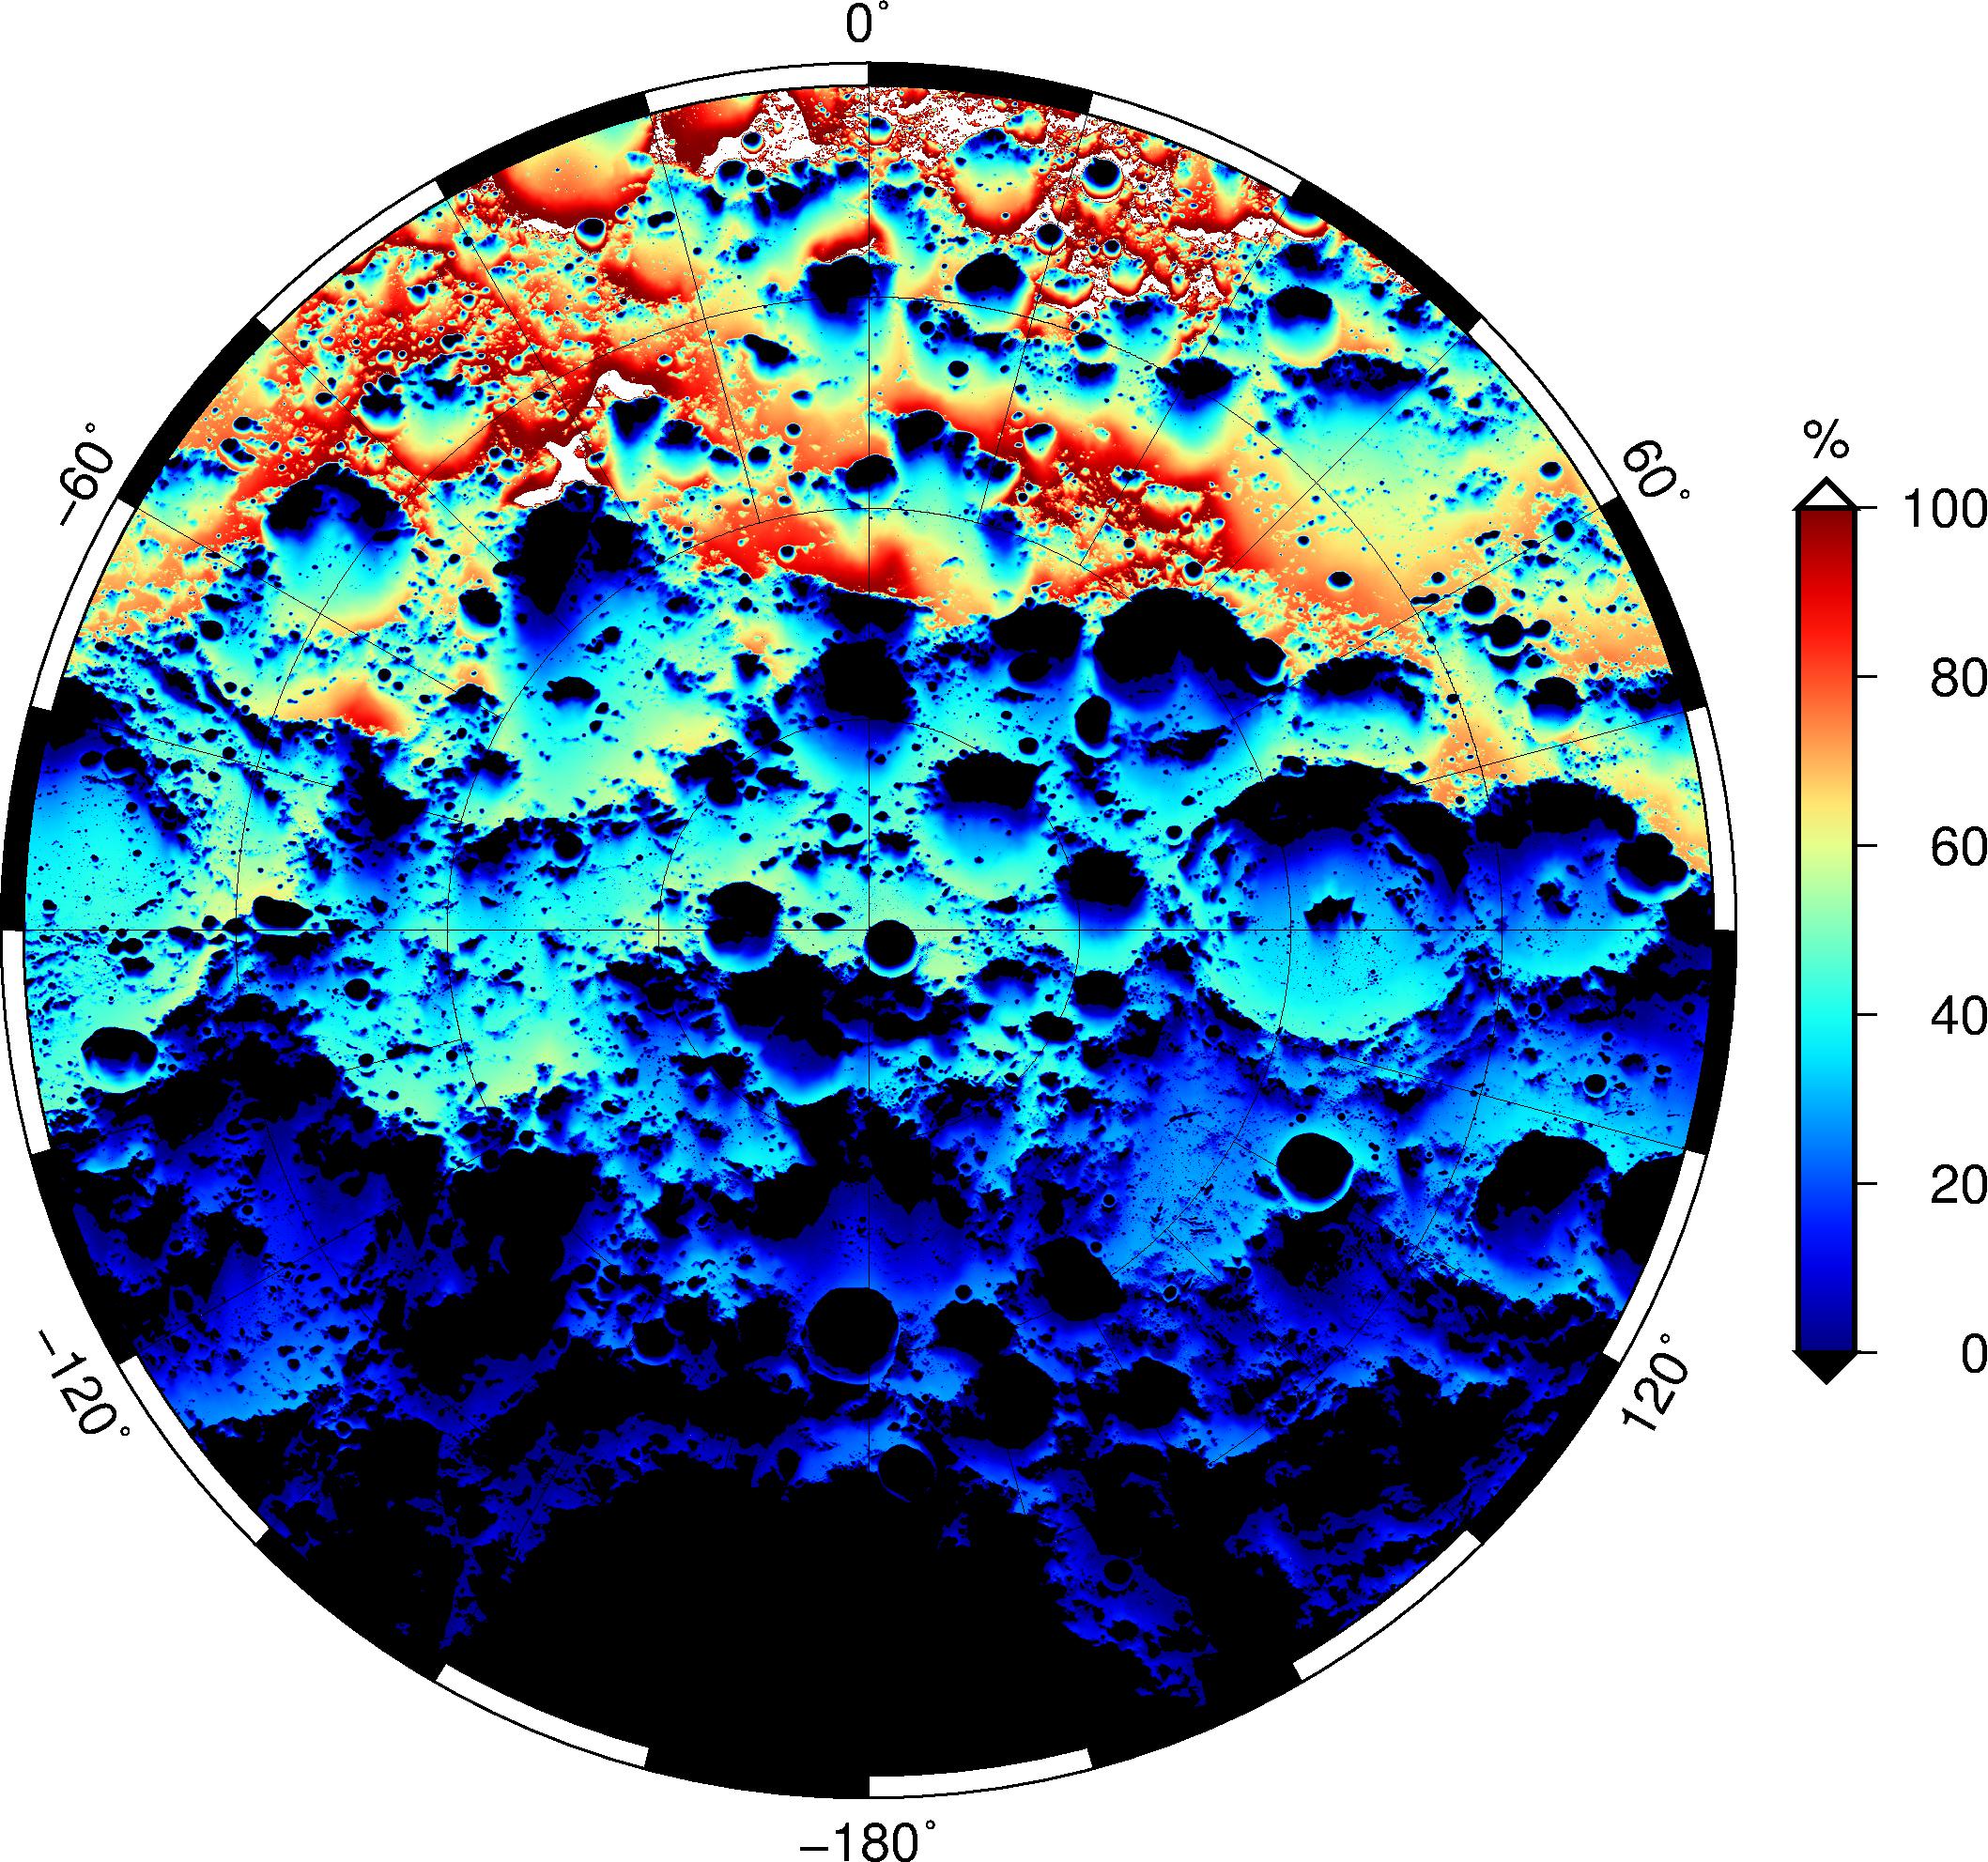
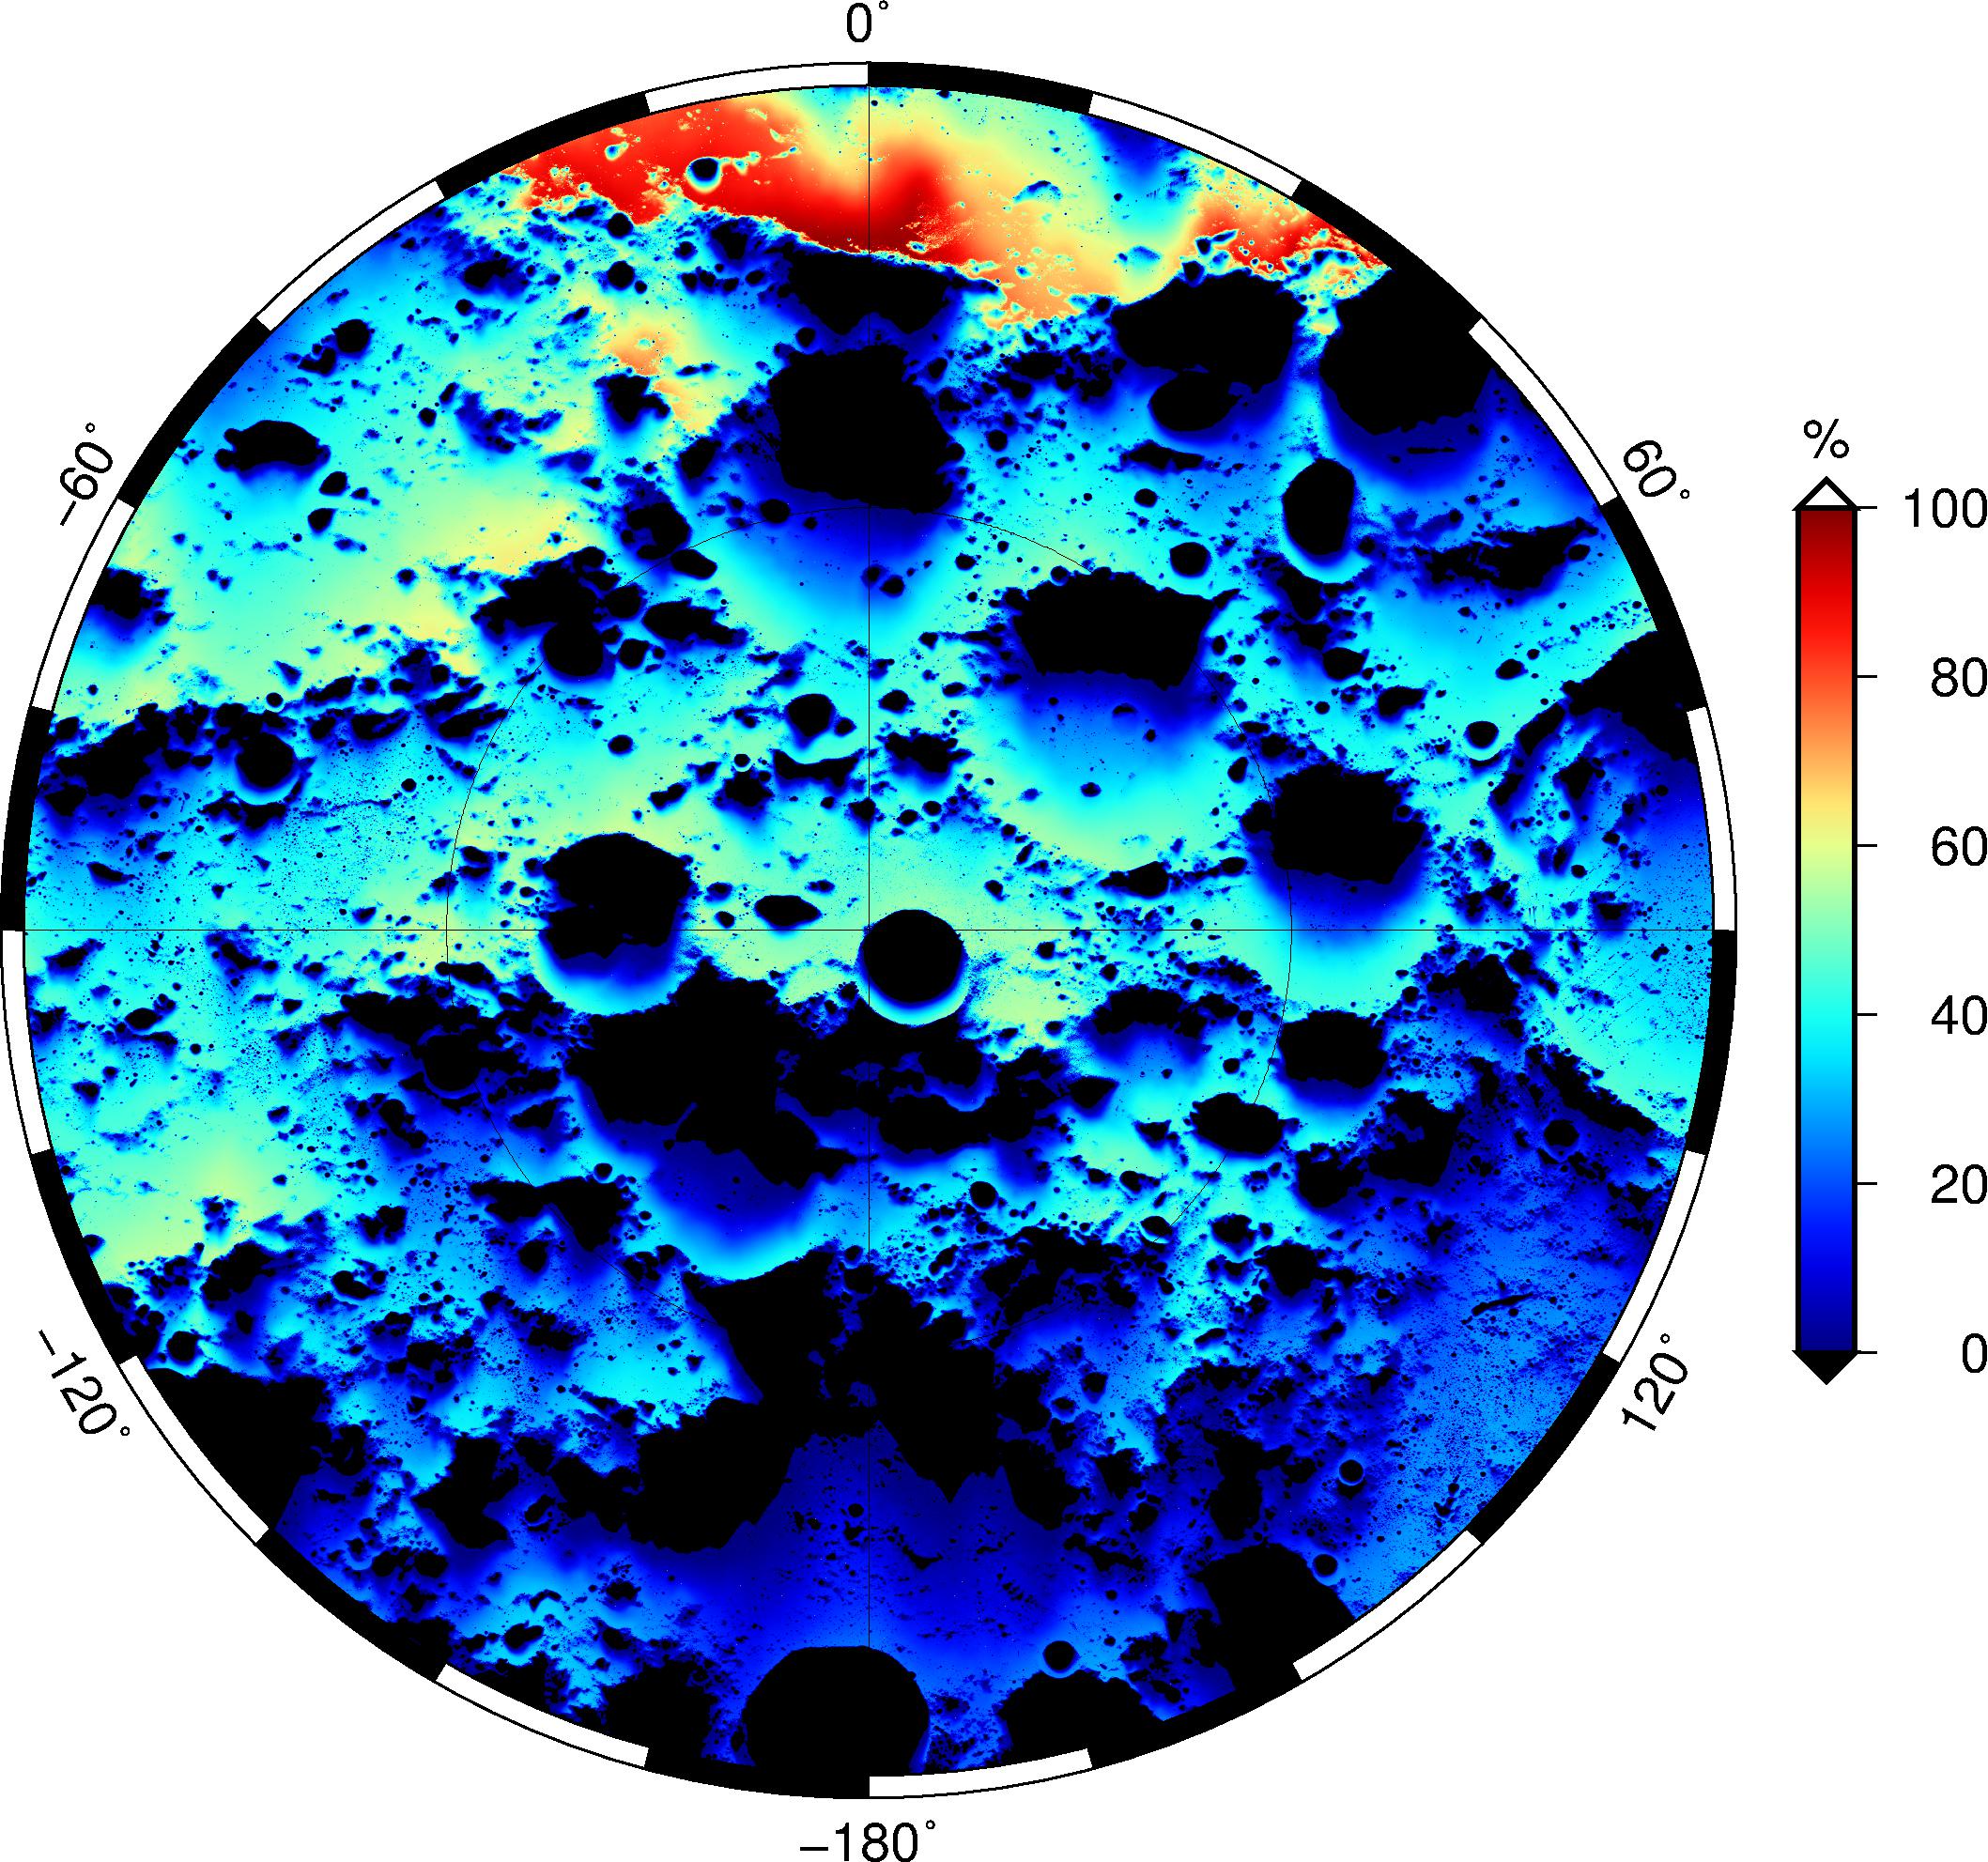
Figure 5. Maps of the Earth visibility, averaged over hourly timesteps spanning 18.6 years, for the south polar region. Shown over 65S-90S (left, 240m/px), 80S-90S (center, 240m/px) and 85S-90S (center, 60m/px).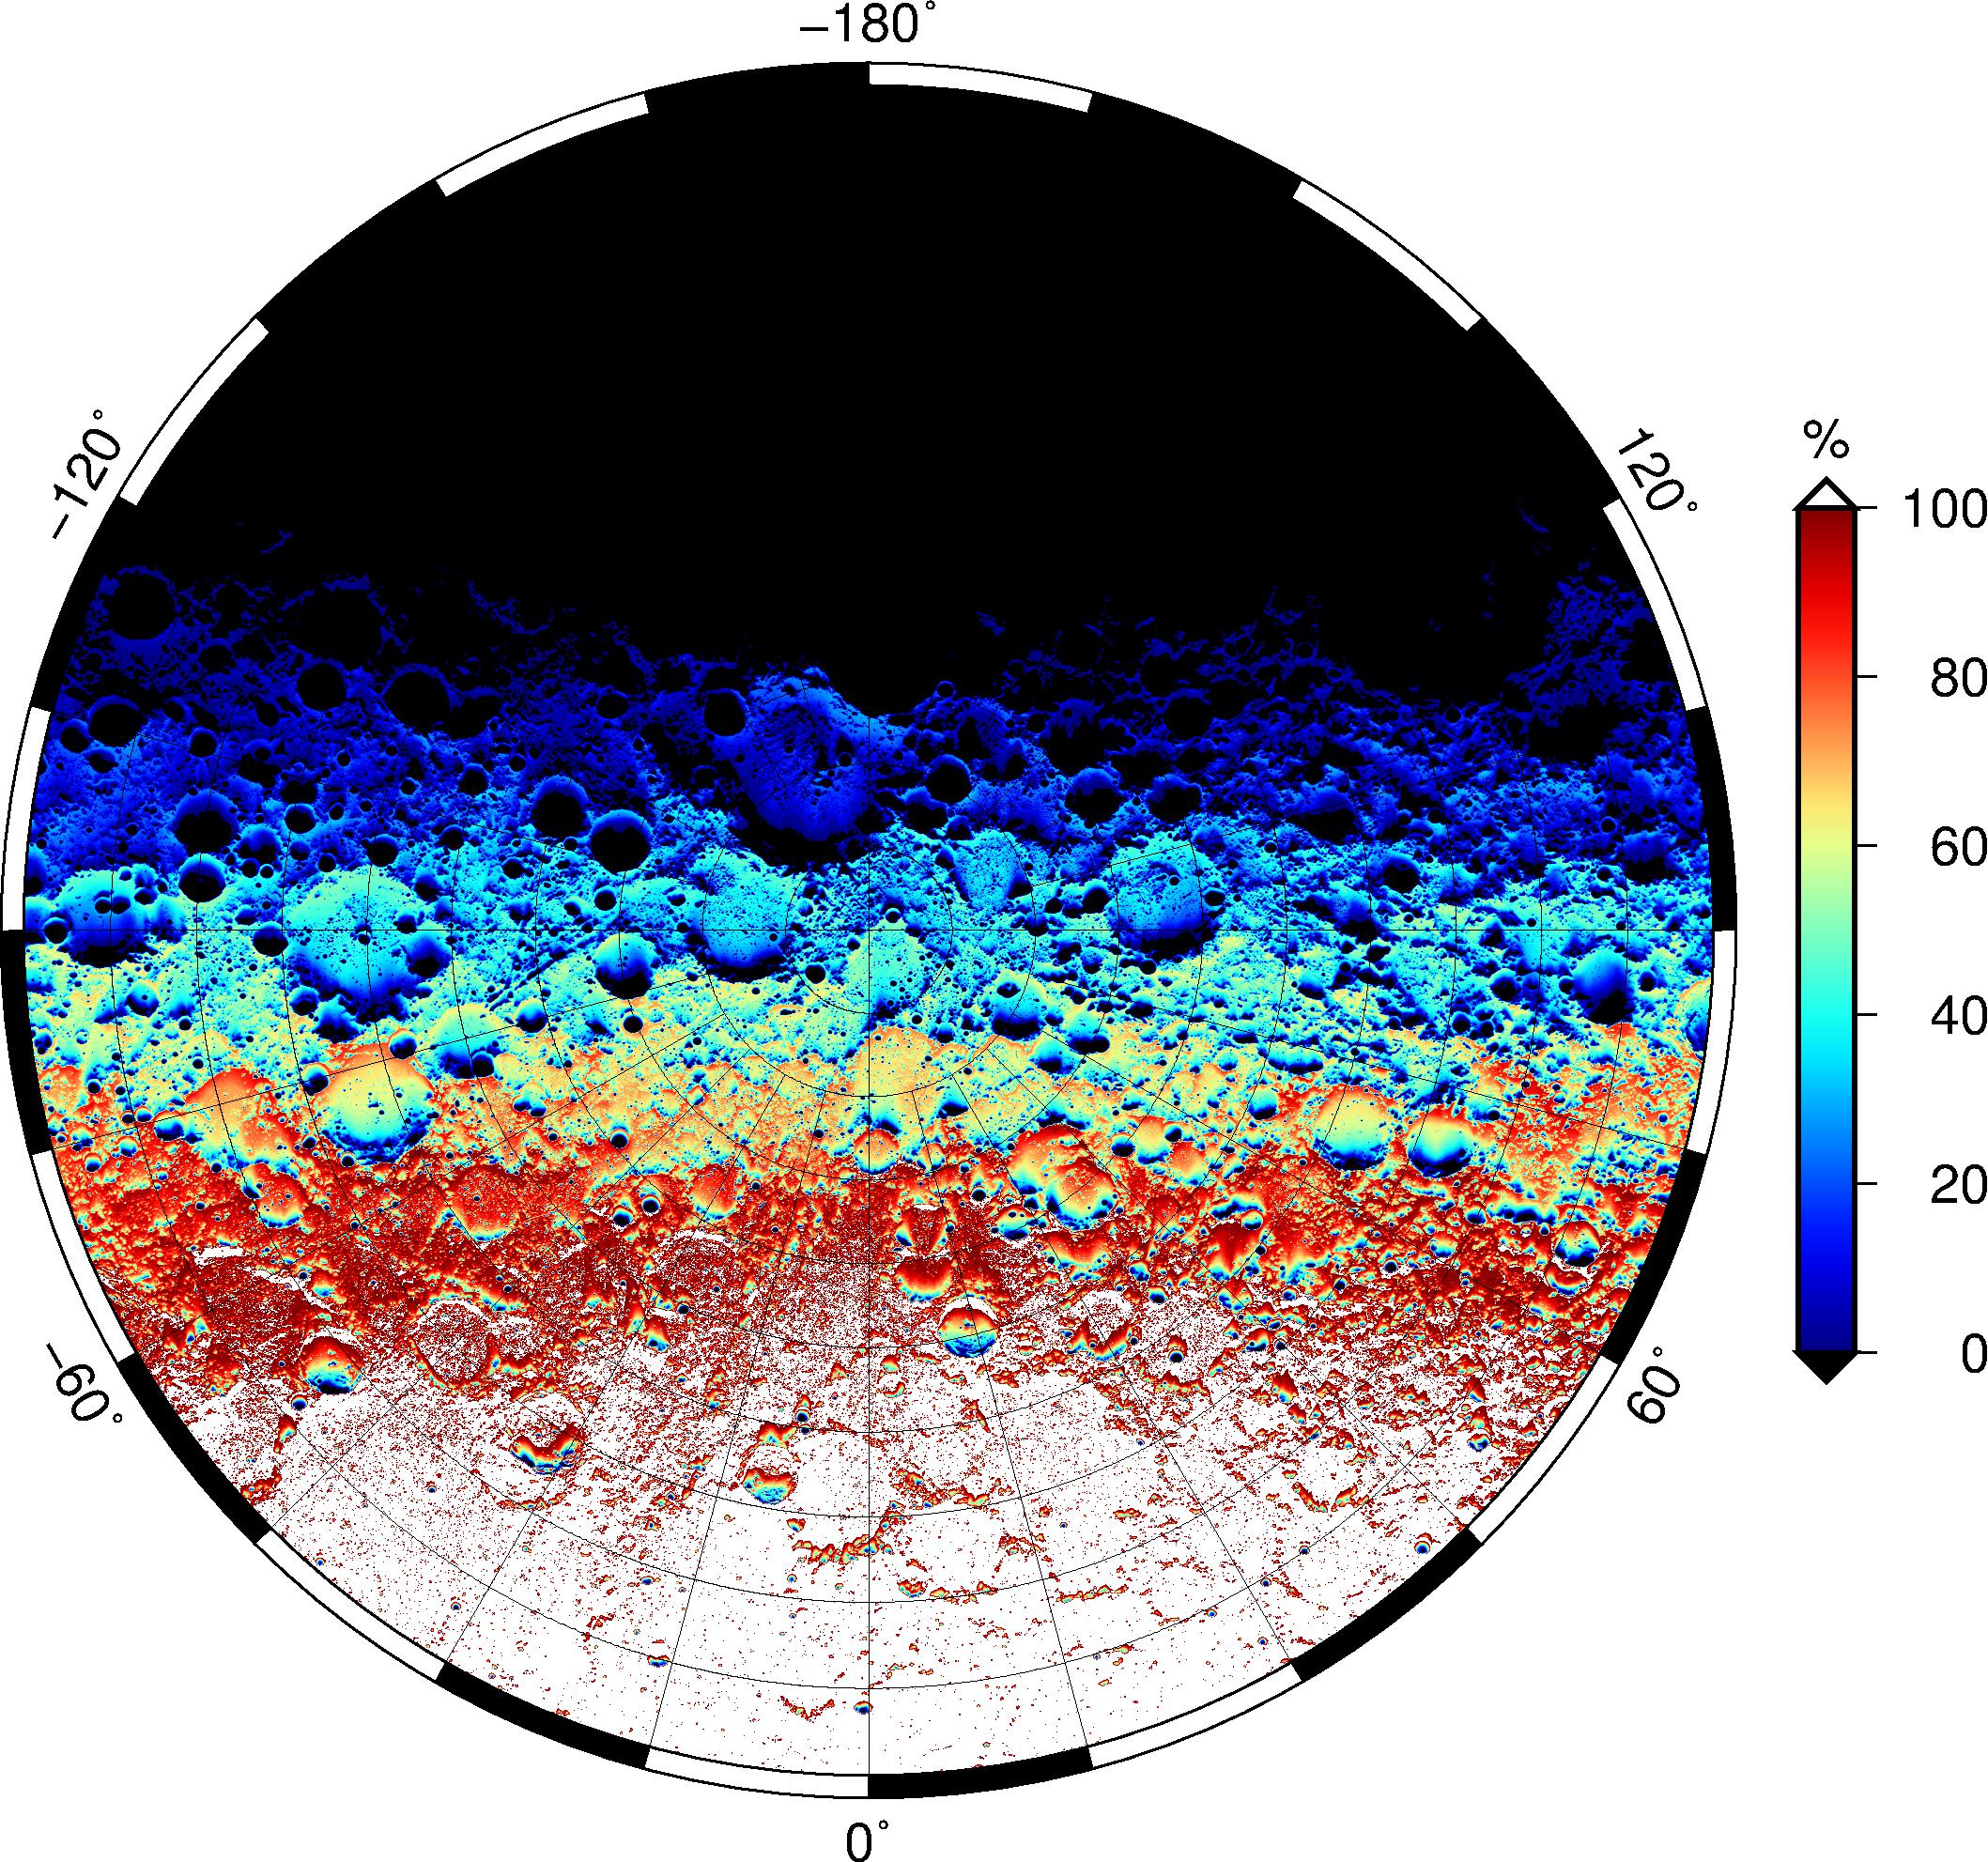
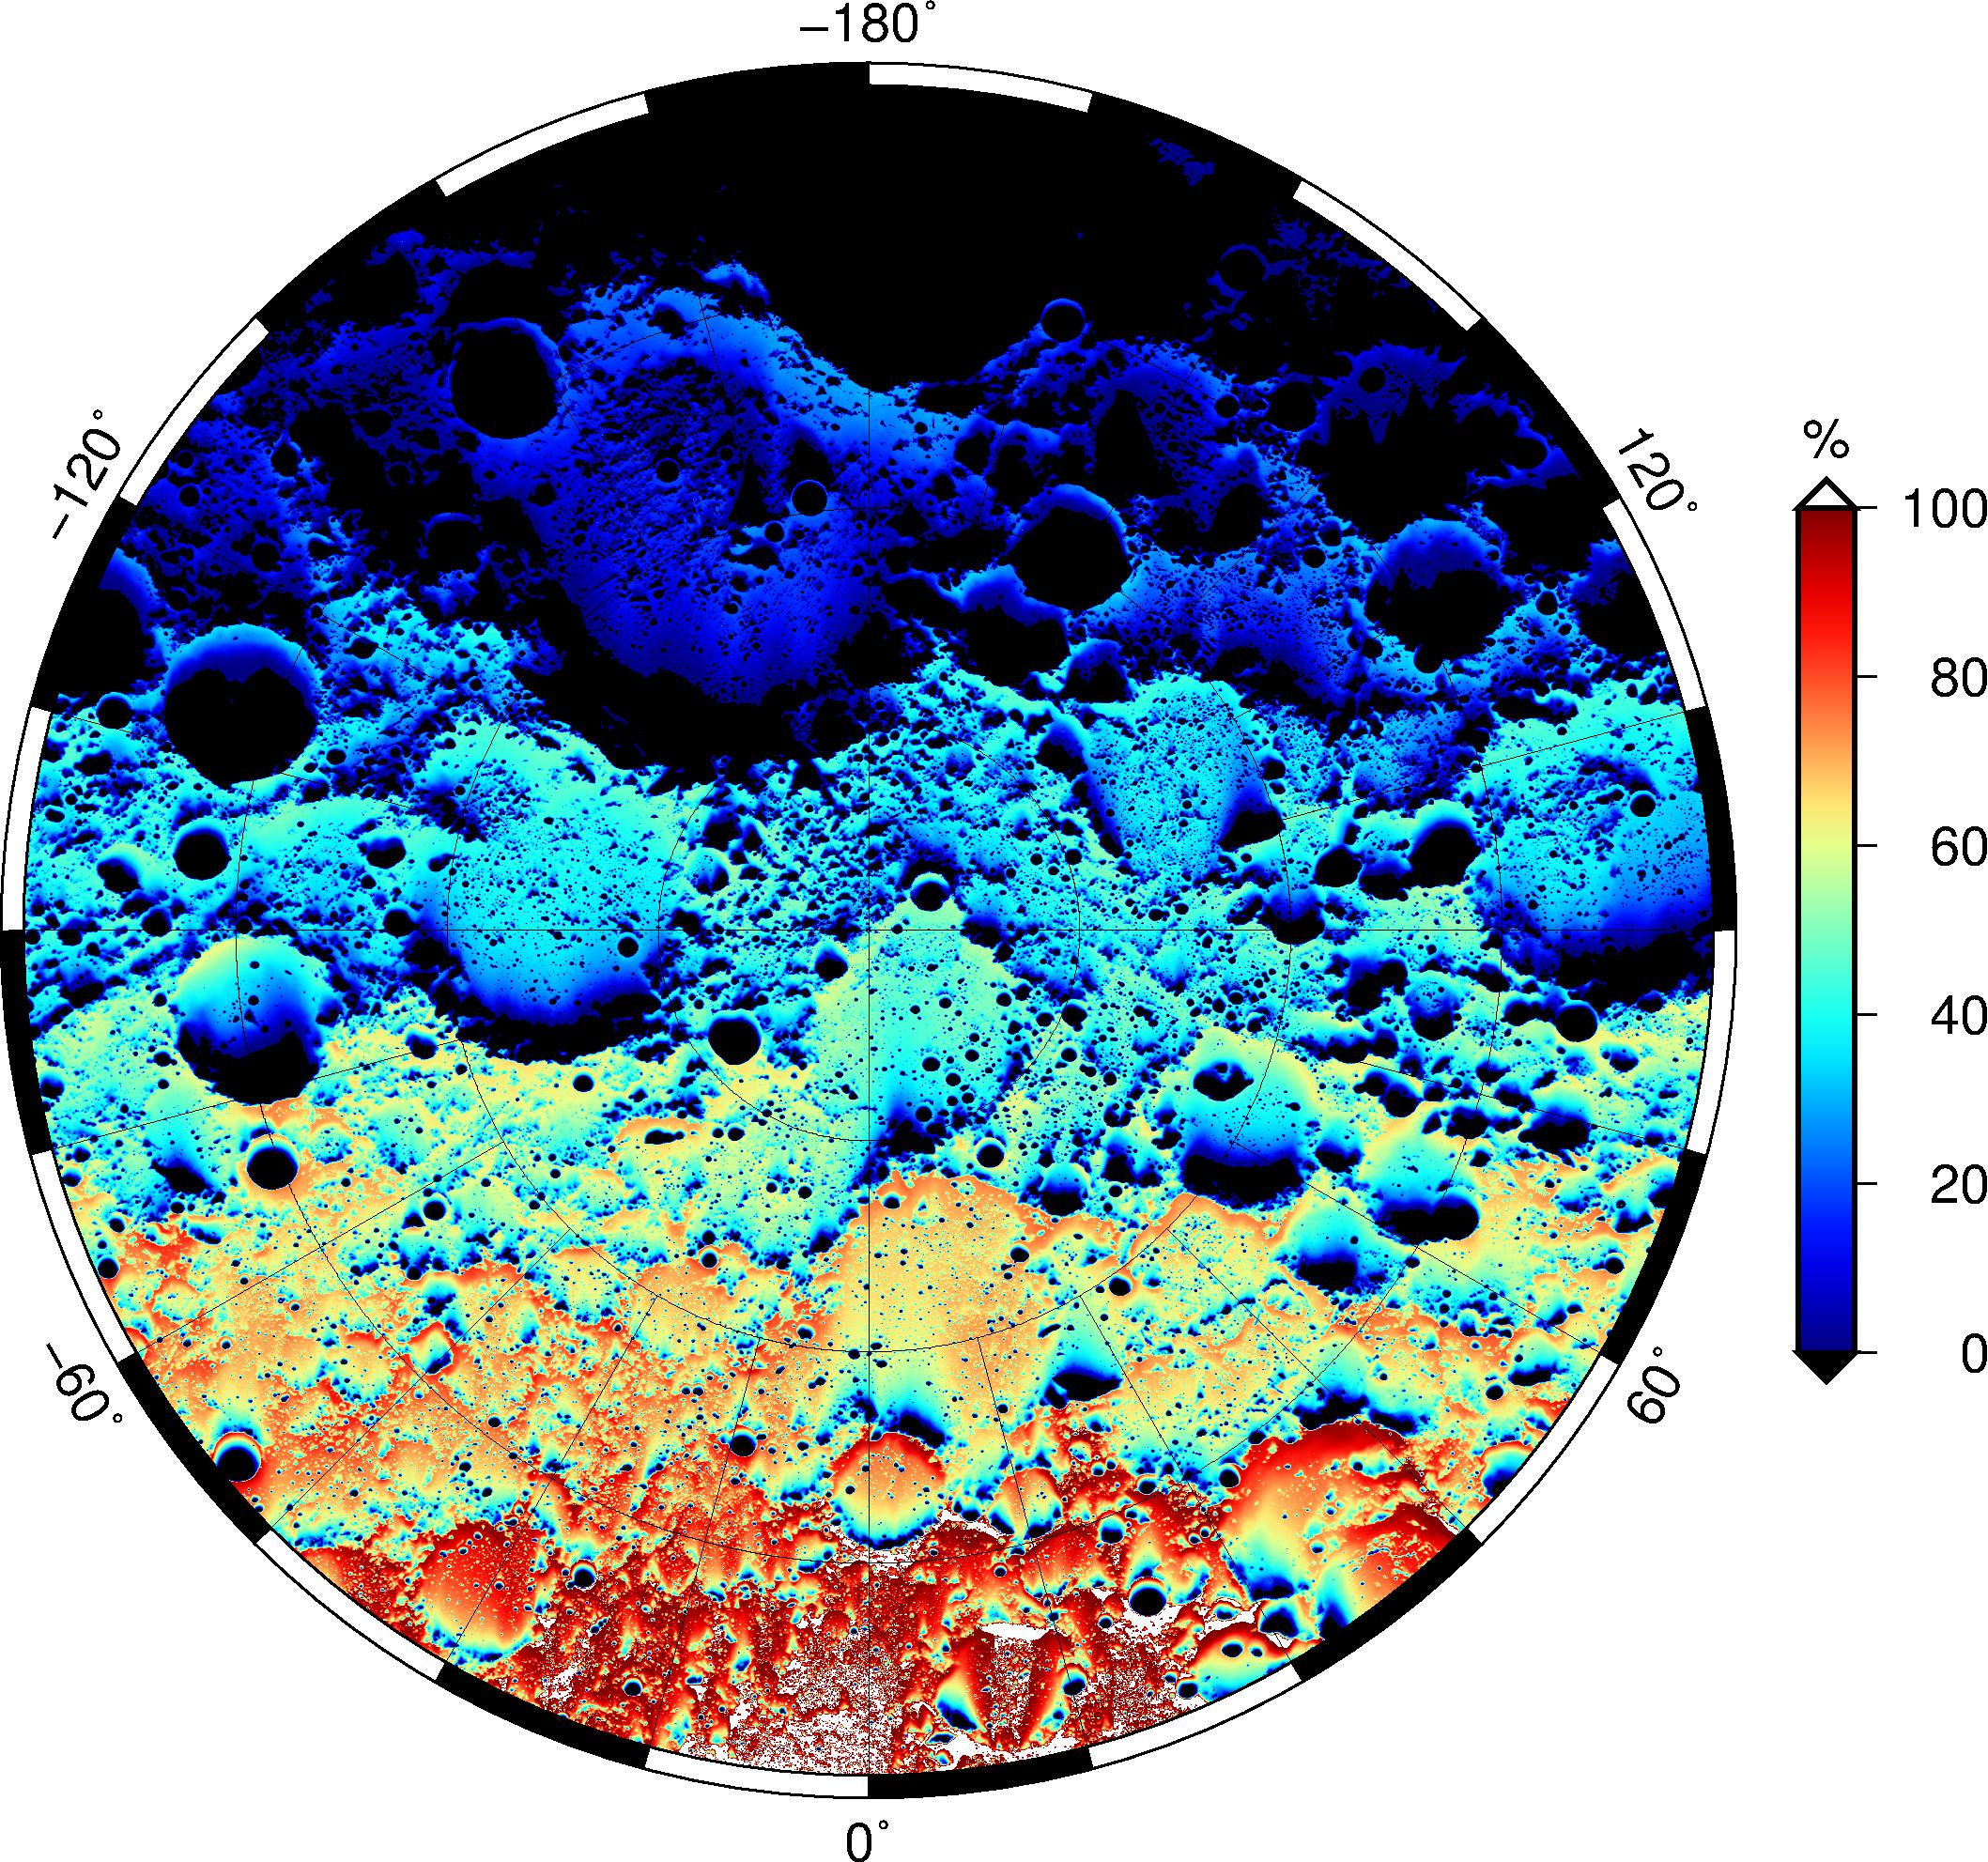
Figure 6. Maps of the Earth visibility, averaged over hourly timesteps spanning 18.6 years, for the north polar region. Shown over 65N-90N (left, 240m/px), 80N-90N (center, 240m/px) and 85N-90N (center, 60m/px).
Sky Visibility
Because our light source is not a point but rather a finite disc, it is very simple to change its position and size to study the visibility of the Earth from the lunar poles rather than the solar
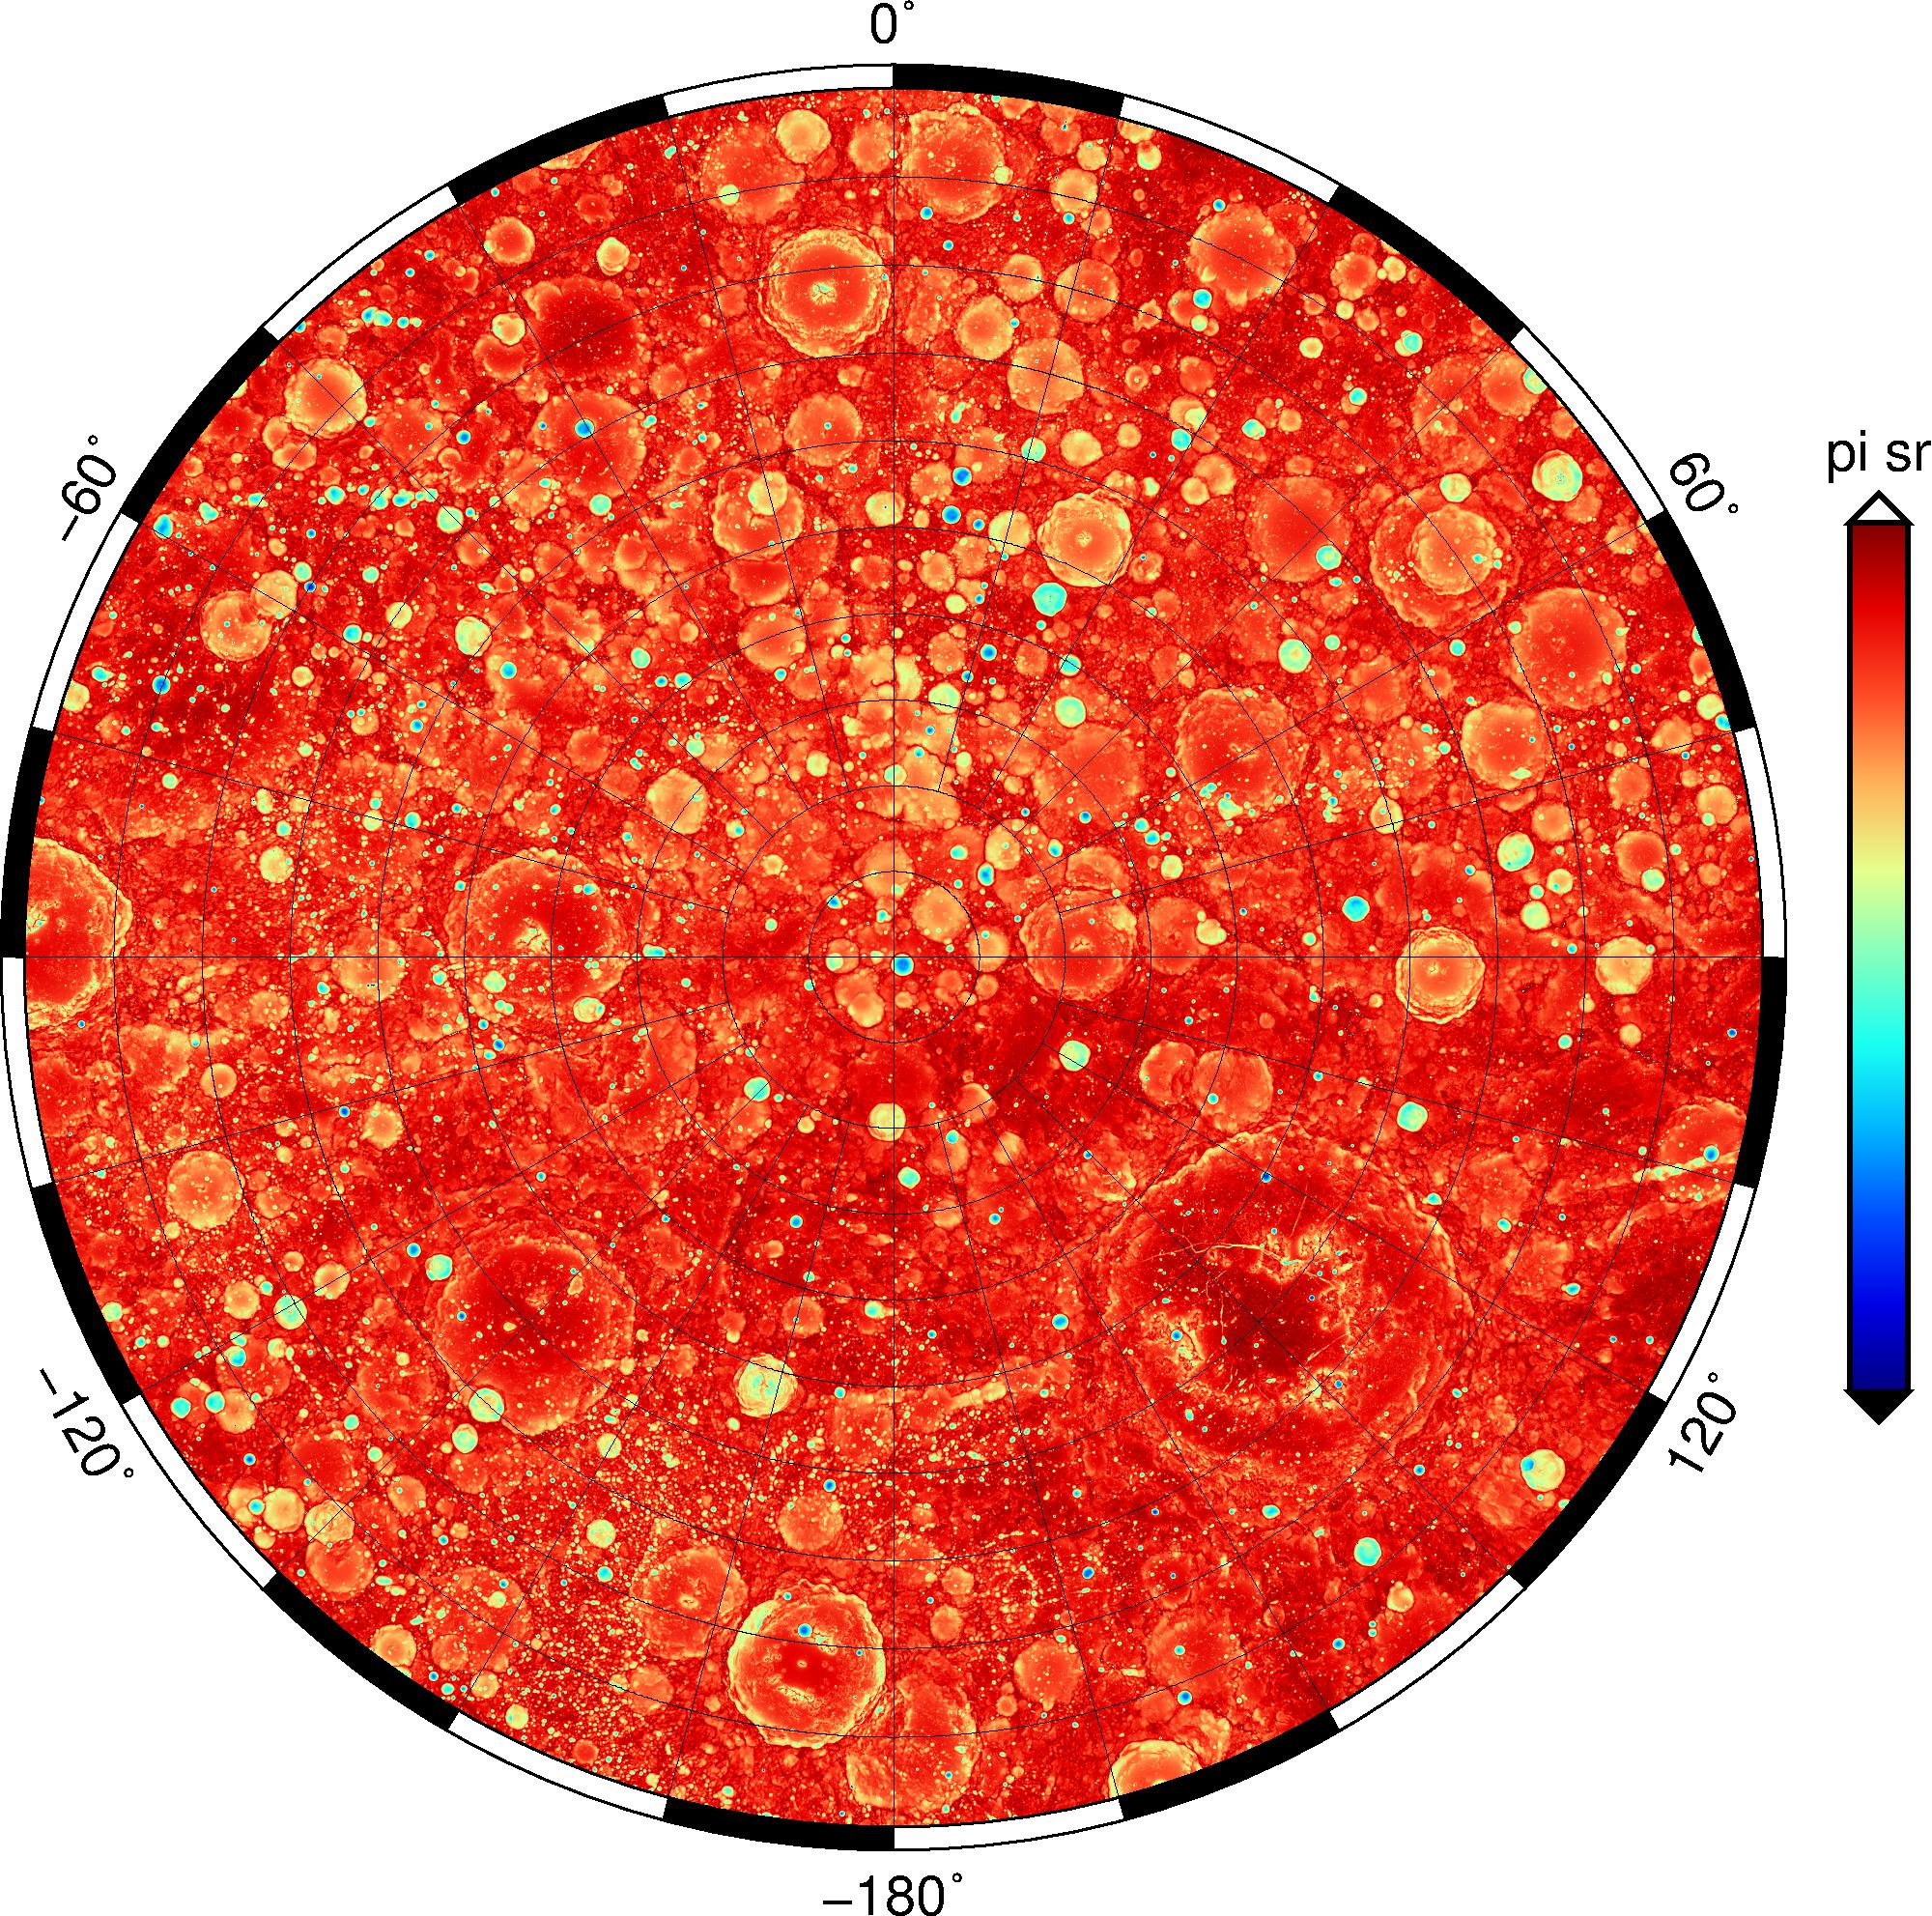
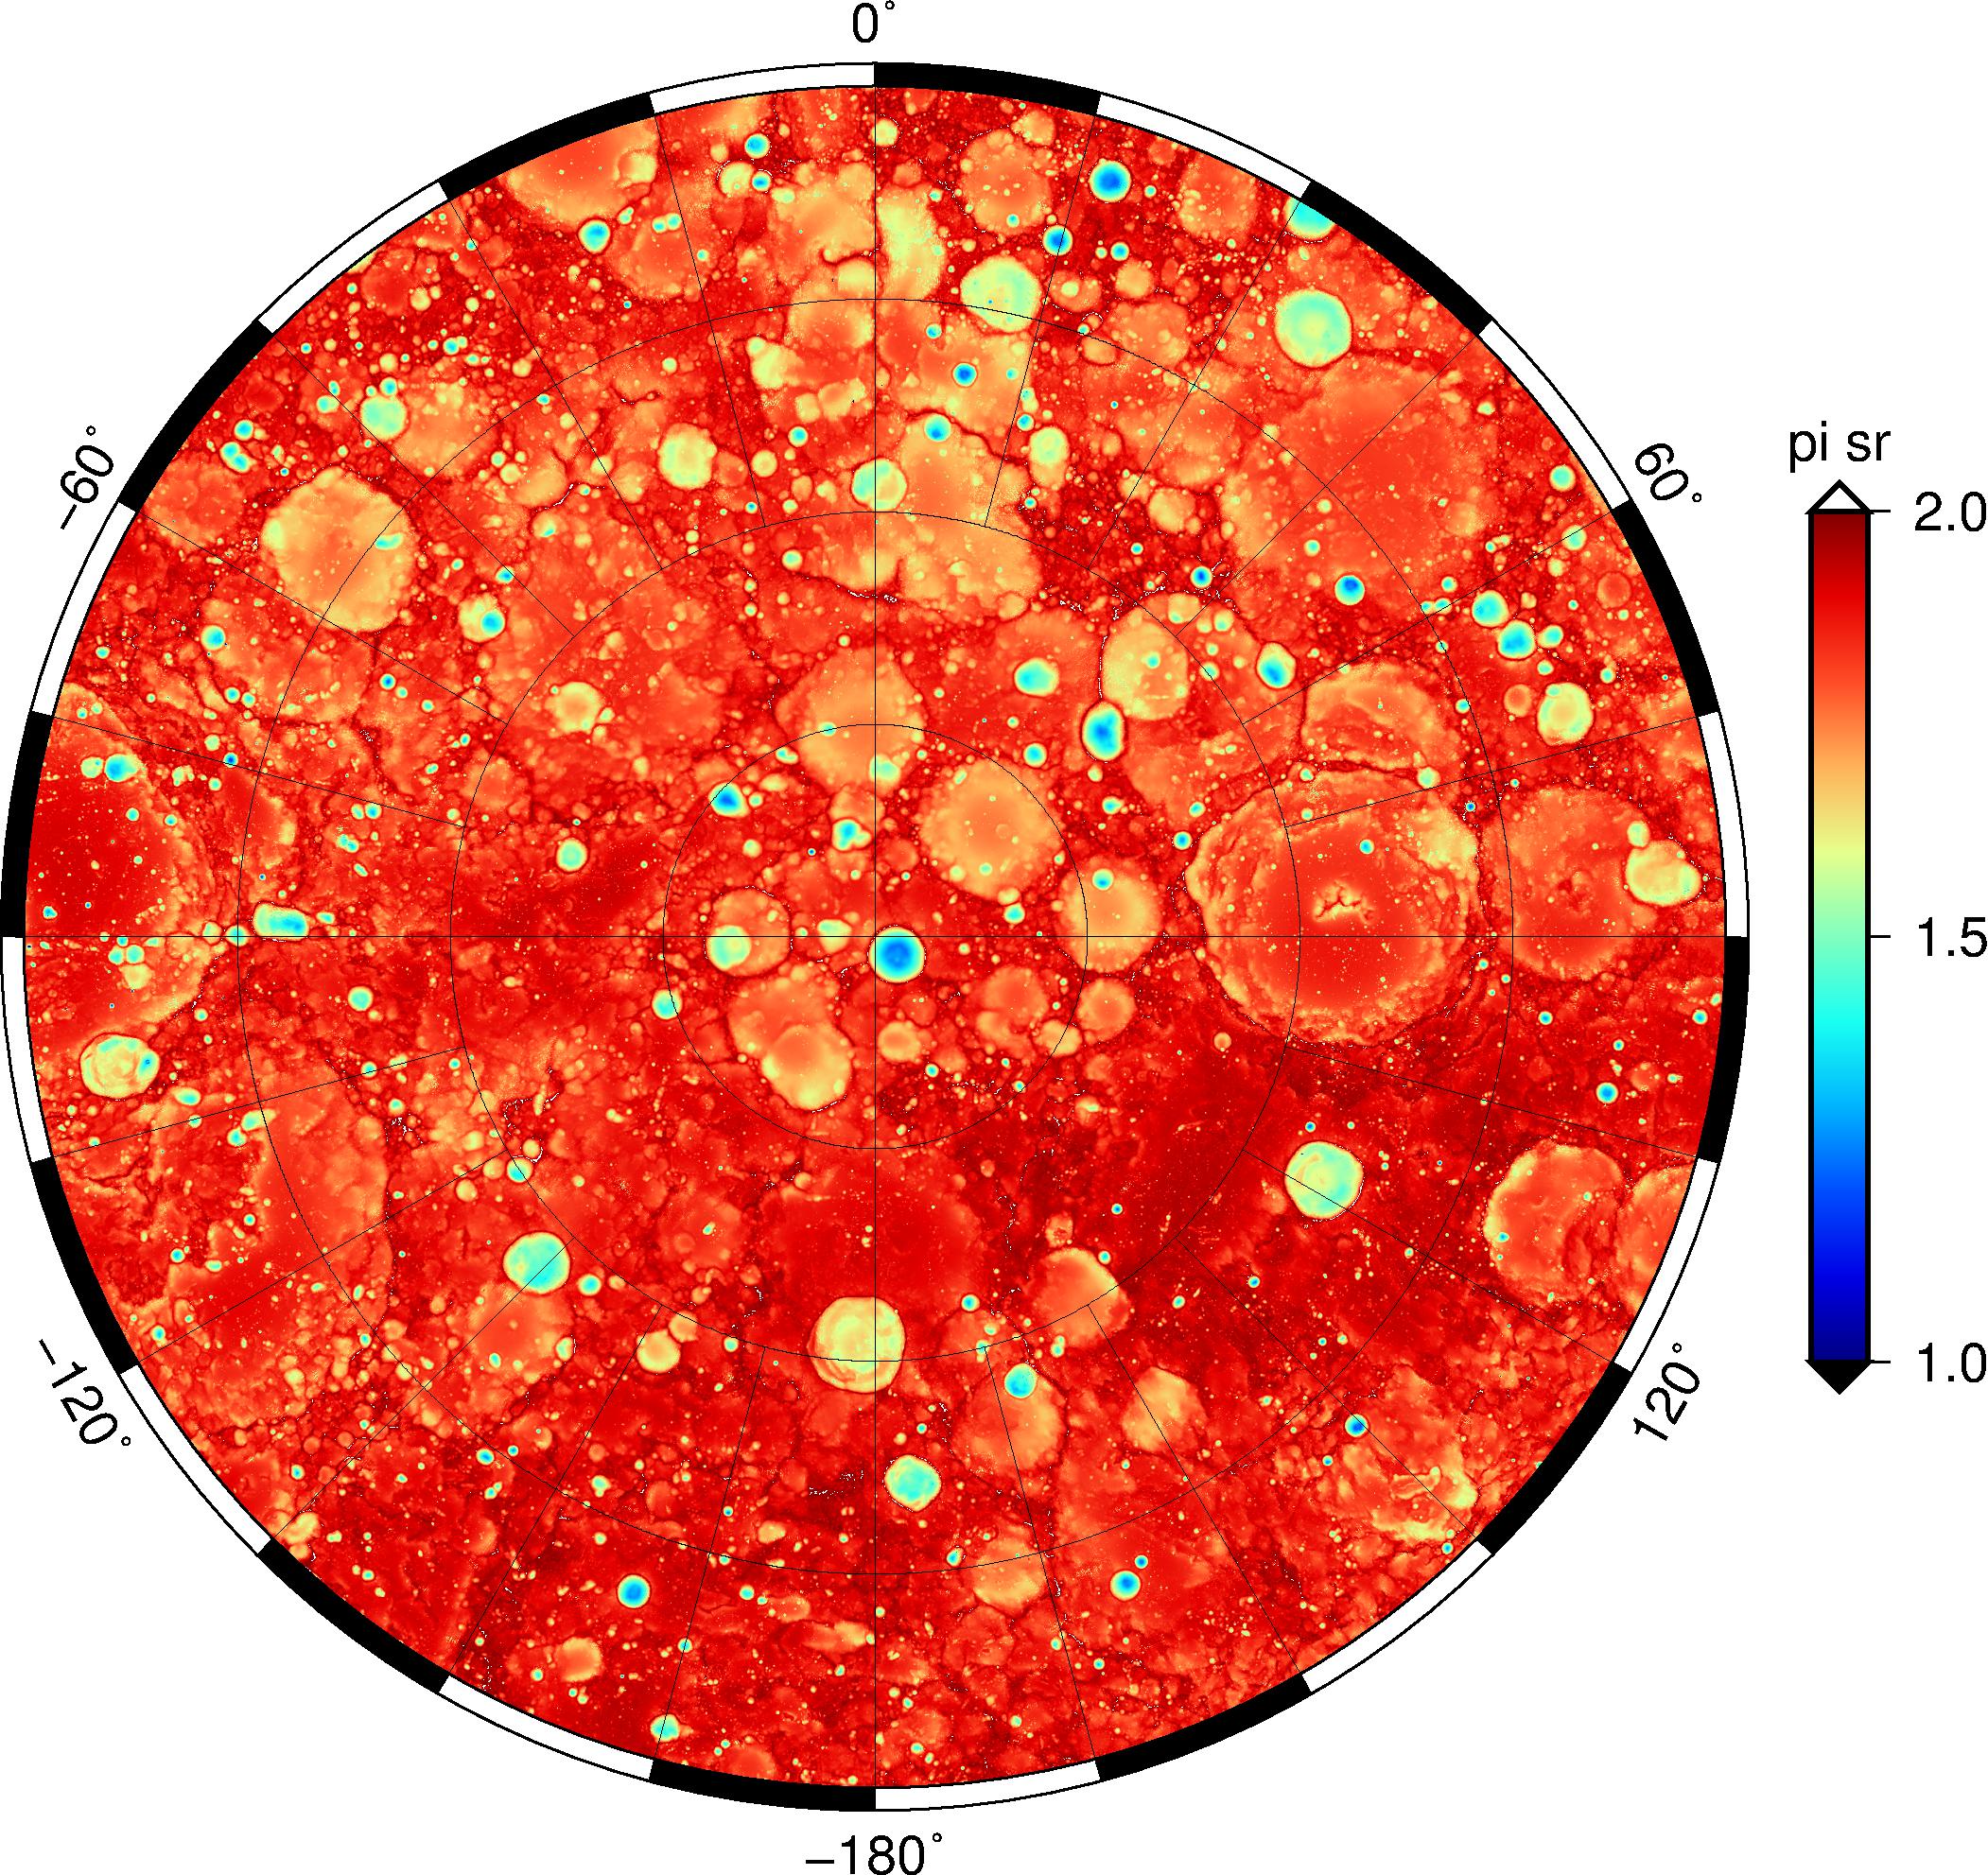
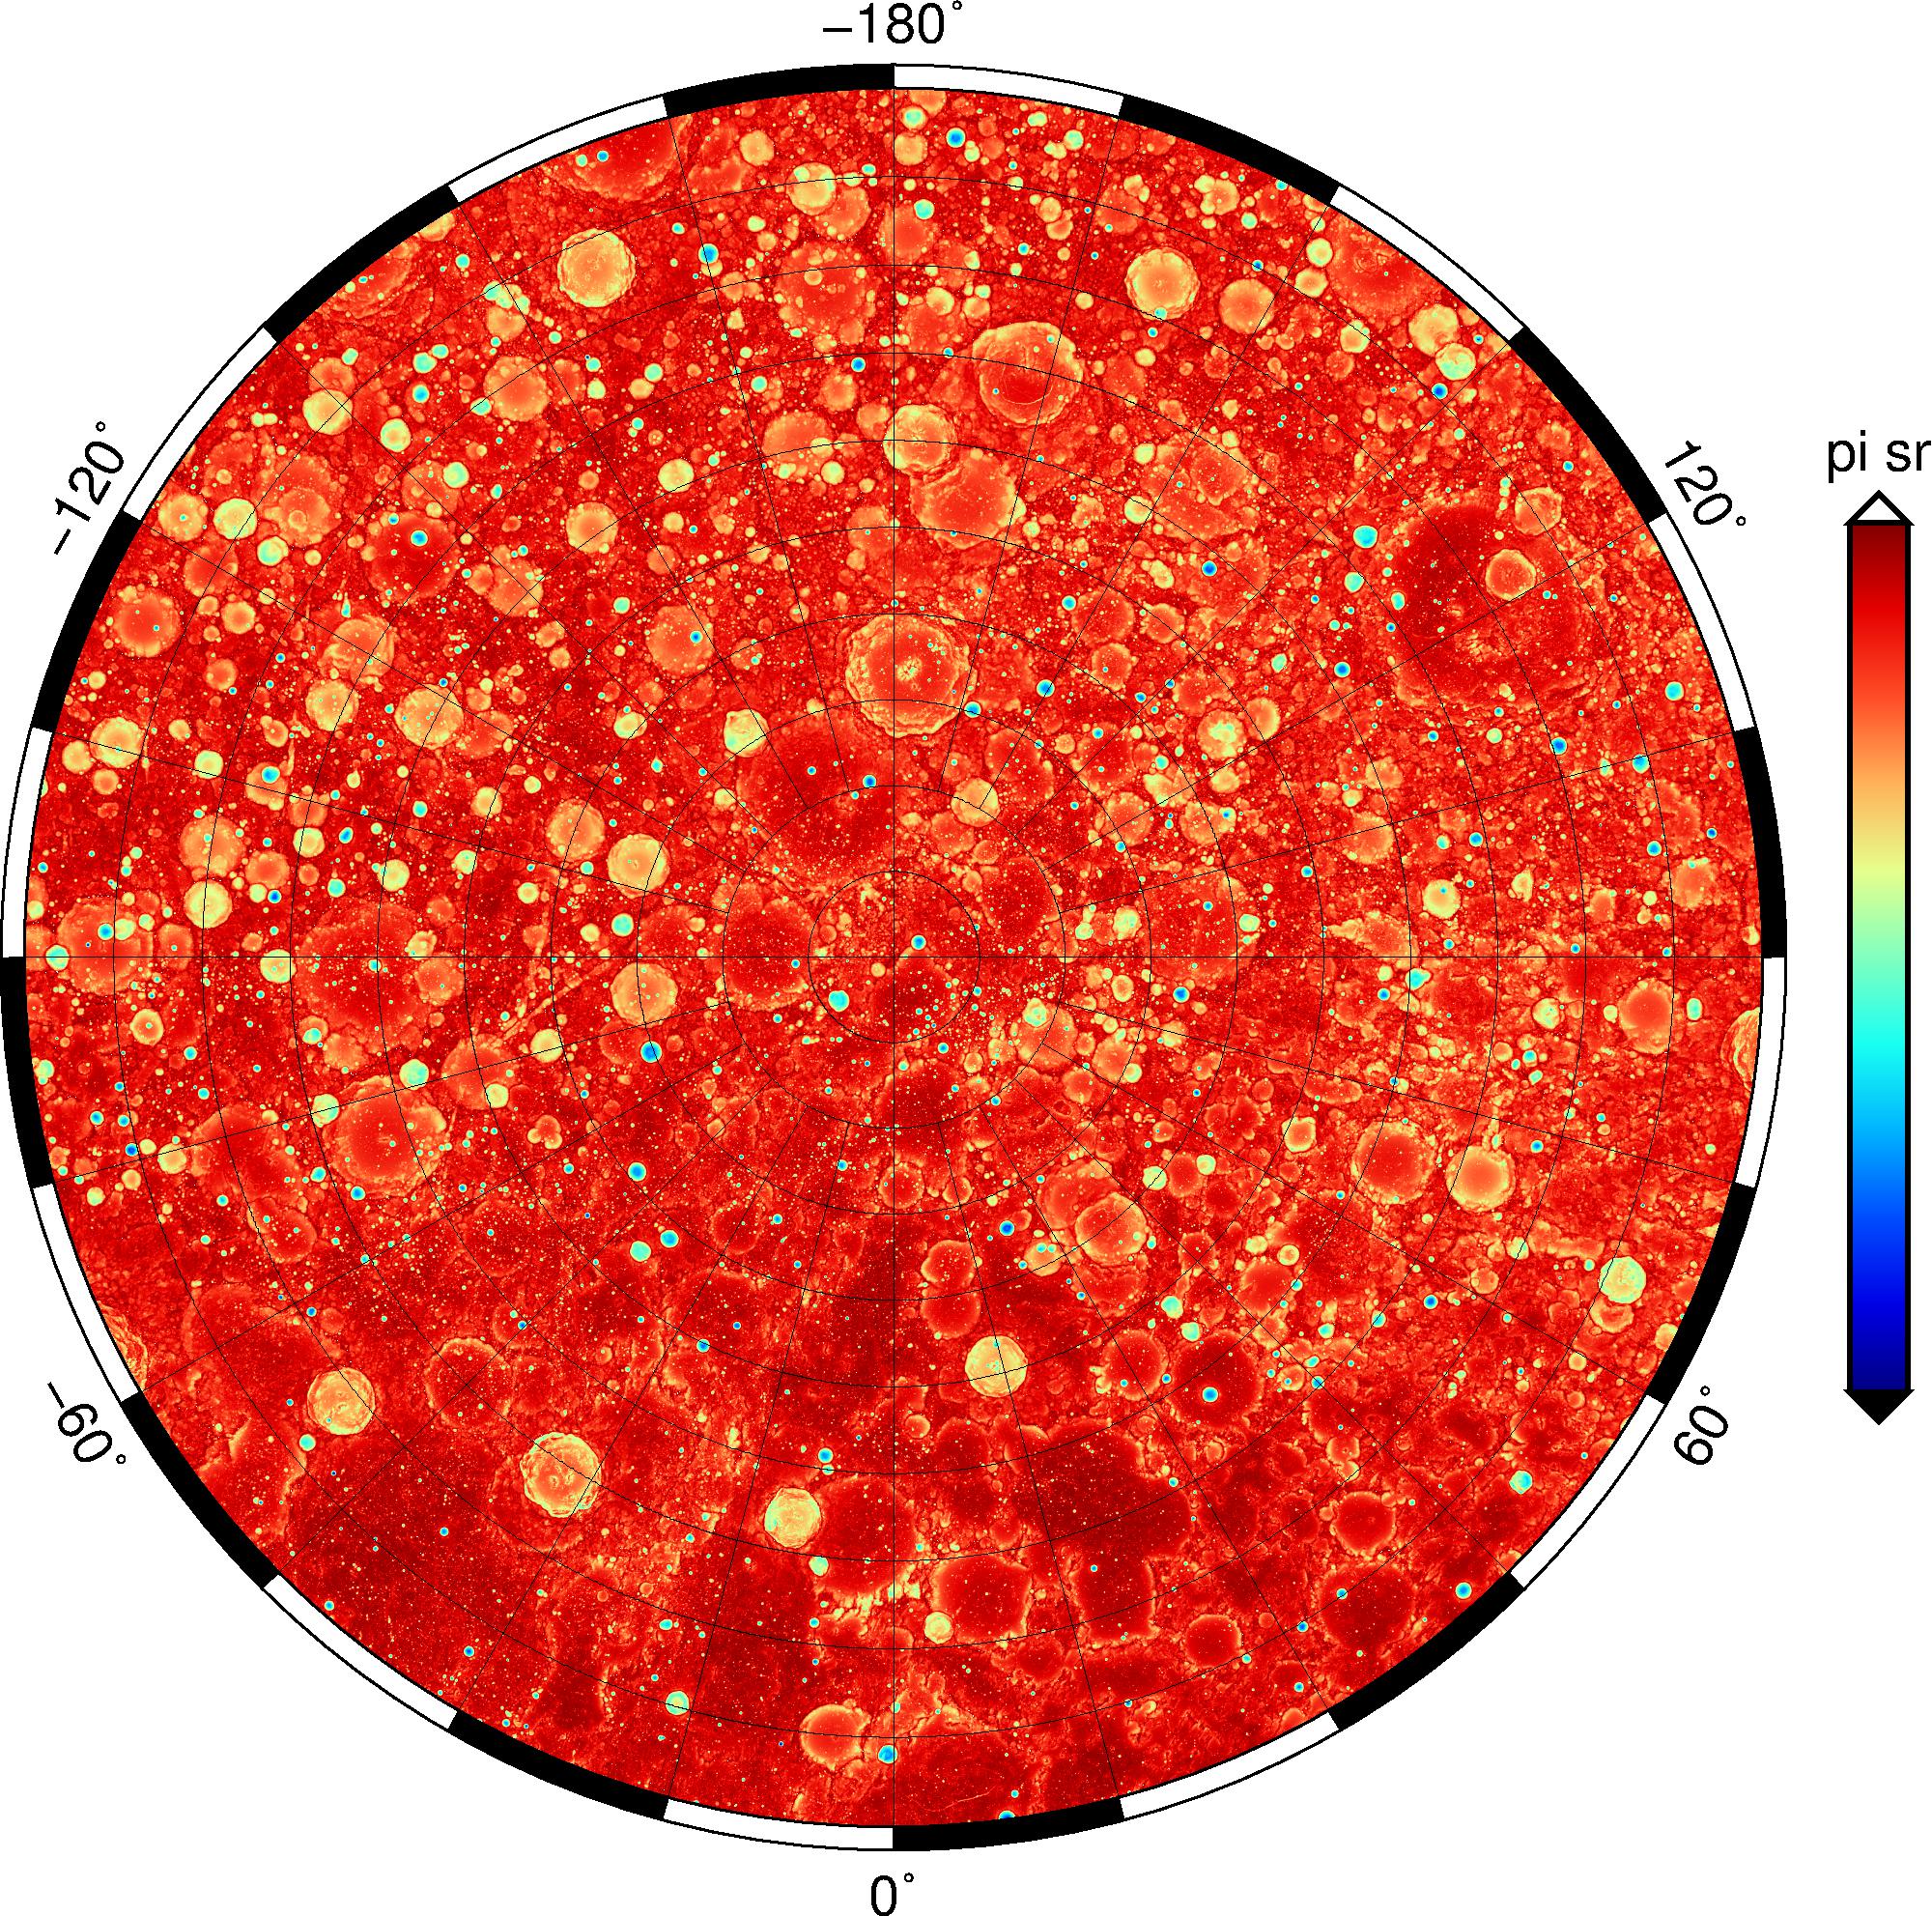
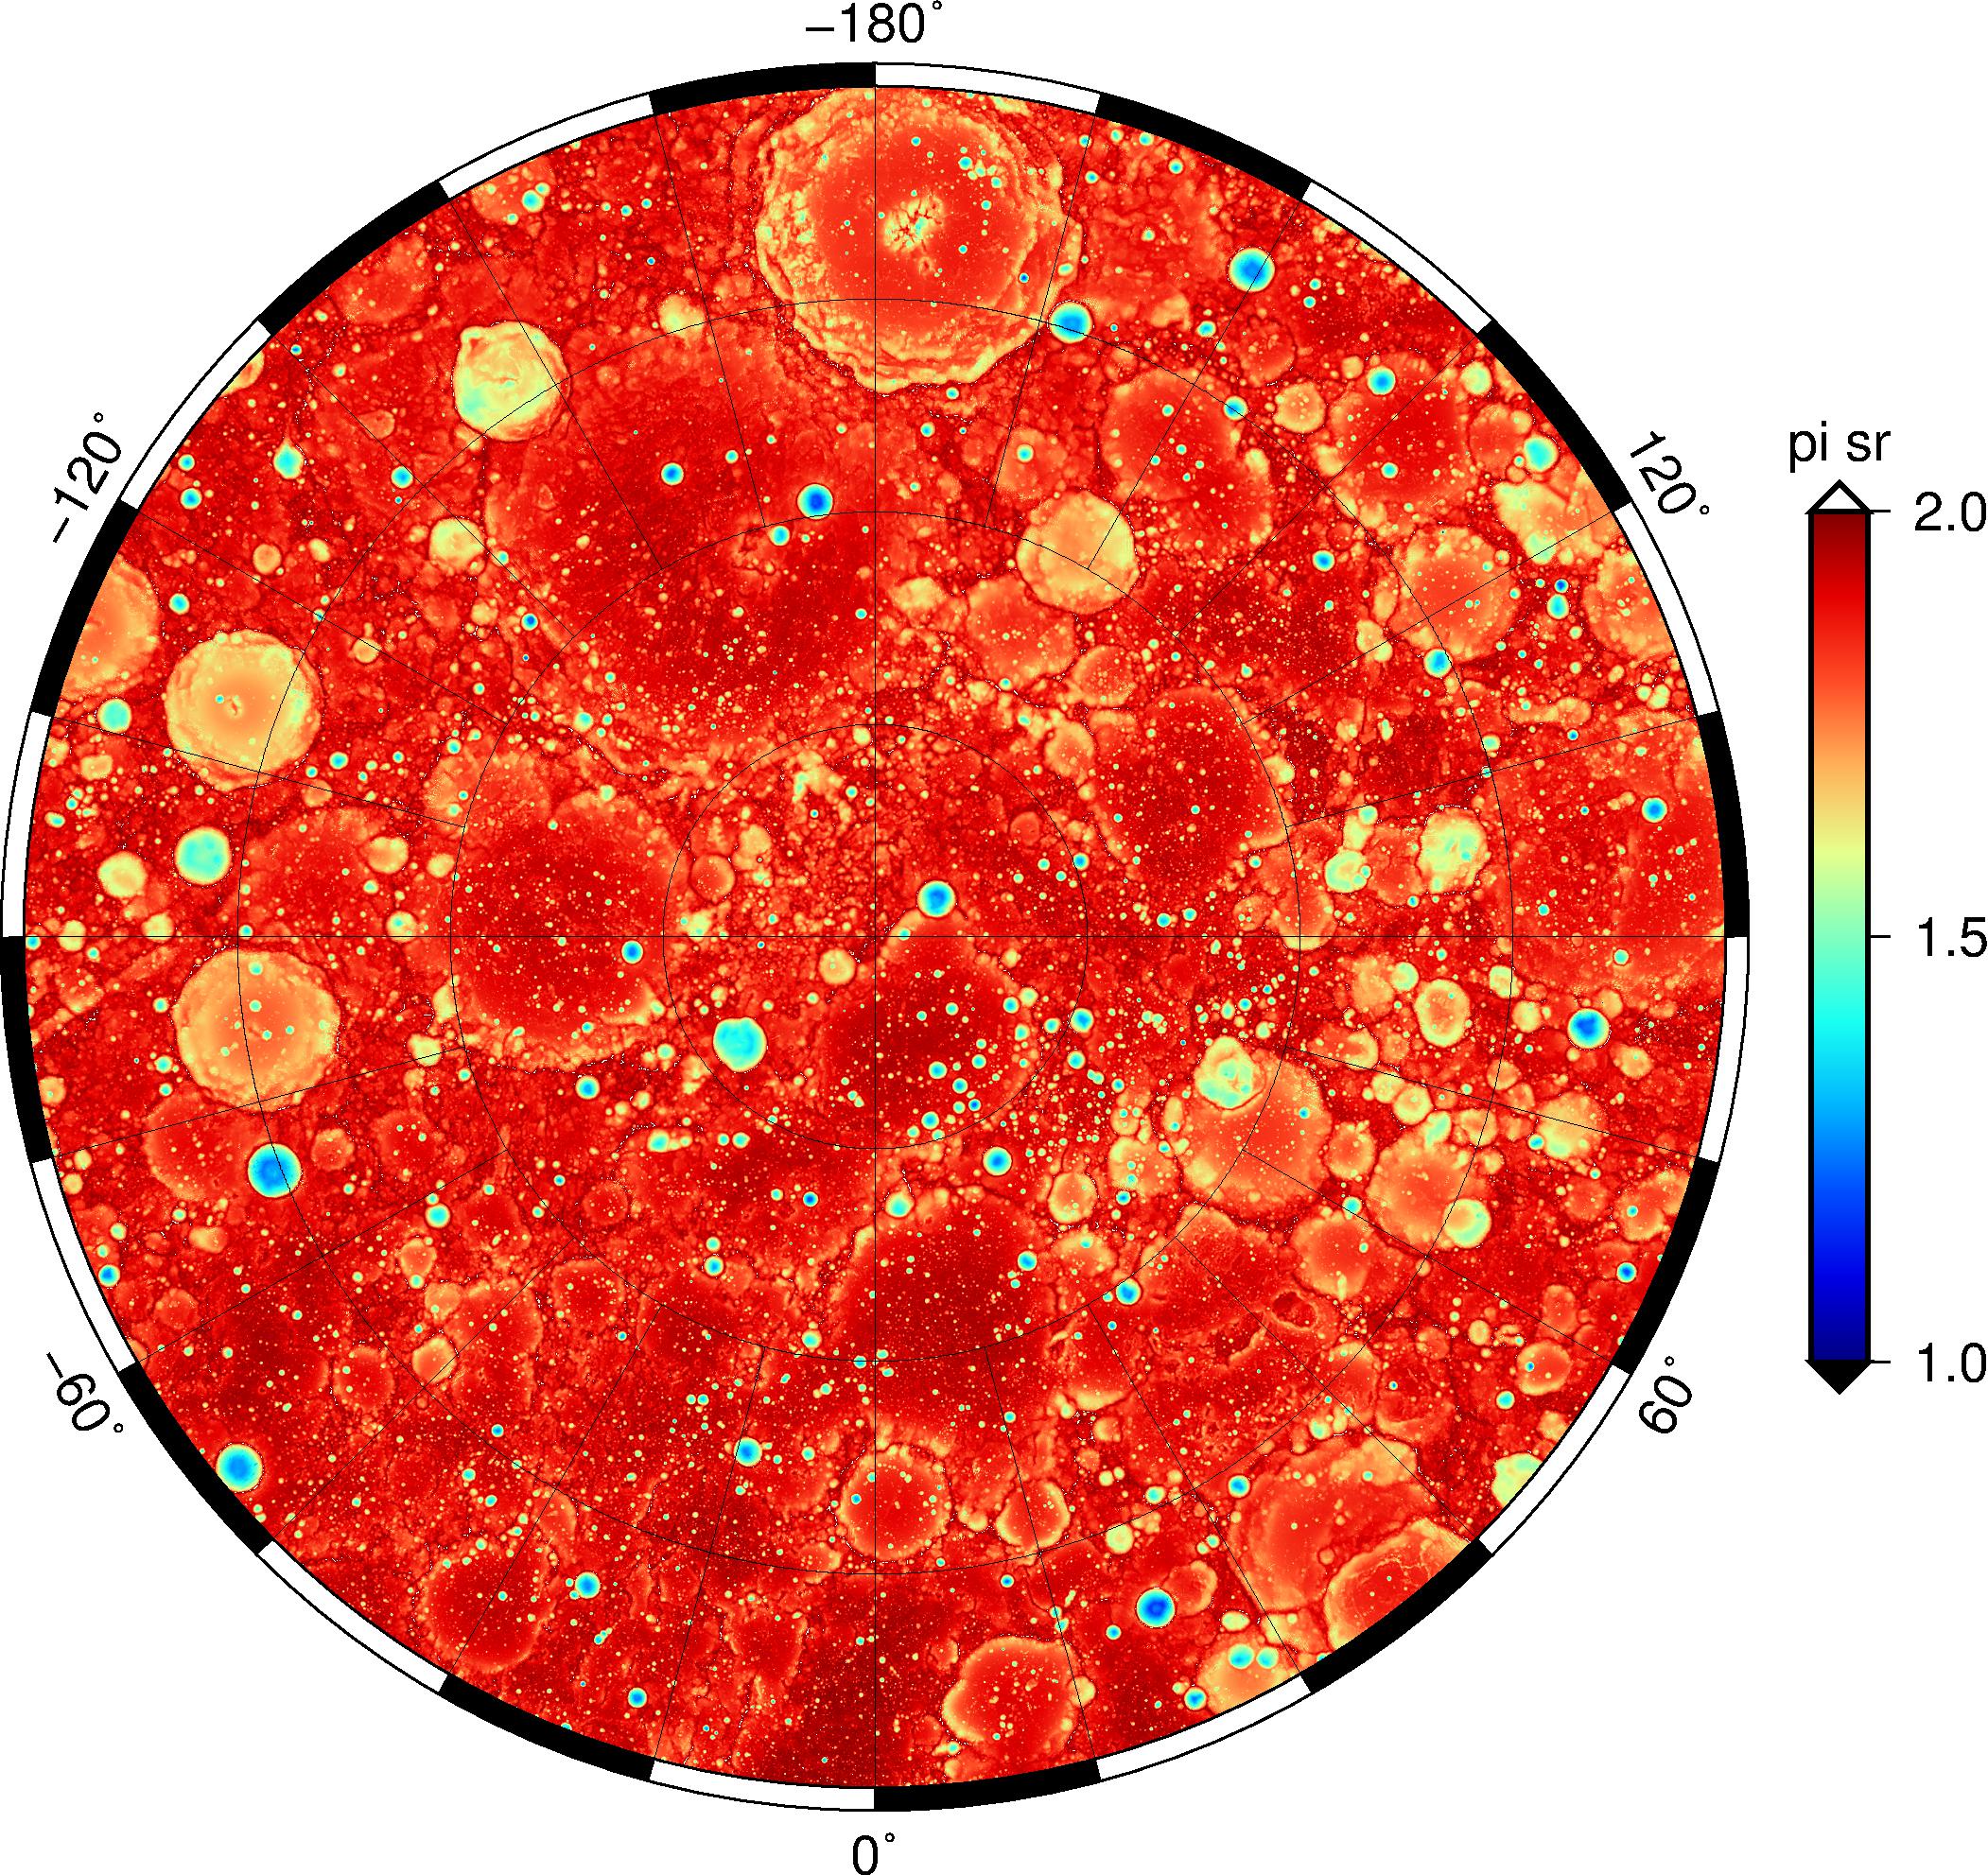
Figure 7. Maps of the sky visibility (solid angle not obscured by topography as seen from the surface), for both polar regions (south on left, north on right). Shown over
65-90 and 80-90 latitude bands.
Data Access
The data are available on the LOLA PDS Data node and the PDS Geosciences Node.
Here are direct links to the majority of these products.
New (2025/03/20):
The TIF links are to GeoTIFF-formatted files converted from the IMG products, and may be more readily imported in GIS software. Scaling/offets should be applied automatically for the GeoTIFFs, but please refer to the PDS label files.
The COG links are to Cloud-Optimized GeoTIFF files, ideal for importing in GIS software with no need to first download. Note that values seen when zoomed out may be taken from overview layers, which are built by averaging true full-resolution values. Be aware of this if doing quantitative analysis.
Average solar illumination
65S-90S, 240 m/px : IMG, JP2, TIF, COG
75S-90S, 120 m/px : IMG, JP2, TIF, COG
85S-90S, 60 m/px : IMG, JP2, TIF, COG
65N-90N, 240 m/px : IMG, JP2, TIF, COG
75N-90N, 120 m/px : IMG, JP2, TIF, COG
85N-90N, 60 m/px : IMG, JP2, TIF, COG
Permanent shadow
65S-90S, 240 m/px : IMG, JP2, TIF, COG
75S-90S, 120 m/px : IMG, JP2, TIF, COG
85S-90S, 60 m/px : IMG, JP2, TIF, COG
65N-90N, 240 m/px : IMG, JP2, TIF, COG
75N-90N, 120 m/px : IMG, JP2, TIF, COG
85N-90N, 60 m/px : IMG, JP2, TIF, COG
Average Earth visibility
65S-90S, 240 m/px : IMG, JP2, TIF, COG
75S-90S, 120 m/px : IMG, JP2, TIF, COG
85S-90S, 60 m/px : IMG, JP2, TIF, COG
65N-90N, 240 m/px : IMG, JP2, TIF, COG
75N-90N, 120 m/px : IMG, JP2, TIF, COG
85N-90N, 60 m/px : IMG, JP2, TIF, COG
Sky visibility
65S-90S, 240 m/px : IMG, JP2, TIF, COG
65N-90N, 240 m/px : IMG, JP2, TIF, COG
Citation
Please cite the Mazarico et al. (2011) reference below when using the LOLA illumination maps available on the PDS.
References
Bussey, D.B.J., et al. (2010), Illumination conditions of the south pole of the Moon derived using Kaguya topography, Icarus, Vol. 208, pp. 558-564, doi:10.1016/j.icarus.2010.03.028.
Mazarico, E., et al. (2011), Illumination conditions of the lunar polar regions using LOLA topography, Icarus, Vol. 211, pp. 1066-1081, doi:10.1016/j.icarus.2010.10.030.
Margot, J.L., et al. (1999), Topography of the Lunar Poles from Radar Interferometry: A Survey of Cold Trap Locations, Science, Vol. 284, pp.1658-1660, doi:10.1126/science.284.5420.1658.
Noda, H., et al. (2008), Illumination conditions at the lunar polar regions by KAGUYA (SELENE) laser altimeter, GRL, 35, L24203, doi:10.1029/2008GL035692.
Speyerer, E.J., M.S. Robinson (2013), Persistently illuminated regions at the lunar poles: Ideal sites for future exploration, Icarus, Vol. 222, pp. 122-136, doi:10.1016/j.icarus.2012.10.010.