Evaluation of Recent Measurements of Mercury's Moments of Inertia and Tides
Sander Goossens
Recent analysis of MESSENGER data based on radio tracking data (Genova et al., 2019) or Mercury Laser Altimeter data (MLA; Bertone et al., 2021) put Mercury unambiguously in an equilibrium Cassini state, but with different resulting obliquity values. This results in different values for Mercury's moment of inertia (MoI), which has implications for our knowledge of Mercury's interior structure. Genova et al. (2019; from here on denoted by G19) find a normalized polar moment of inertia value of 0.333 ± 0.005, whereas Bertone et al. (2021; B21) find 0.343 ± 0.006. For the lower value of the MoI, G19 find a smaller core size, lower mantle densities than initially assumed, and evidence for a solid inner. Steinbrügge et al. (2021) investigated the MoI values and find that the lower MoI value poses several challenges.
In our paper (Goossens et al., 2022), we evaluated recent measurements of Mercury's MoI with a method different from Steinbrügge et al. (2021). We apply a comprehensive Markov Chain Monte Carlo (MCMC) method to map the MoI values along with their associated errors. This provides a more complete picture of the distribution of parameters that describe Mercury's possible interior structure than focusing on models that map the central values.
We focus on two sets of measurements: those from G19, and those from an earlier analysis by Mazarico et al. (2014; M14). We choose the latter over B19 because M14 co-estimated gravity and Mercury's tidal response, k2. M14 find a value close to that of B21 for the MoI, of 0.349 ± 0.014, which is also close to other MoI values found from Earth-based radar (e.g., Margot et al., 2012) or altimetry e.g., Stark et al., 2015). For k2, M14 find a value of 0.451 ± 0.014 , whereas G19 find 0.569 ± 0.025. In our analysis, we also include measurements of Mercury's bulk density (with a 0.2% error), and the ratio between the crust and mantle polar moment and the full polar moment, Cm/C. We use k2 as a measurement, or we predict it.

Figure 1. Heat map of the normalized polar moment of inertia versus k2 for different measurements. The parameter k2 was either a measurement, or predicted.
We find that models that match the lower polar moment values from G19 also match its accompanying Love number value, when we use k2 as a measurement or when we predict it. For the higher MoI from M14, we find an even higher k2. We show this in Figure 1, where we show heat maps generated from the point cloud of all MCMC solutions. For G19, the target ellipse (consisting of the measurements of the MoI and k2 and their associated errors) matches the ensemble ellipse, whereas this is not the case for M14. The results of M14 are mainly driven by the small error on k2. When we predict k2, we match the MoI for M14 but find a higher k2.
Data
We present the results of our MCMC analysis for various cases from our paper. For each case we ran about 10 million models, which we then down-selected randomly to about 480,000. For each case, we present those models here. Each file contains 23 entries per line. The entries consist of the parameters that we varied, evaluations of the target values for each model, and a set of derived parameters.
Estimated parameters are:
1: inner core size [m]
2: outer core size [m]
3: mantle density [kg/m3]
4: weight fraction Si in the inner core [%]
5: weight fraction Si in the outer core. Nominally entries 4 and 5 are the same but we present a case where they are different. [%]
6: temperature at the core-mantle boundary (CMB) [K]
7: grain size [m]
8: crustal thickness [m]
9: crustal density [kg/m3]
10: unrelaxed rigidity of the crust [Pa]
11: unrelaxed rigidity of the mantle [Pa]
12: reference viscosity [Pa s]
Target values:
13: normalized polar moment of inertia C/MR2 [no unit]
14: ratio of bulk density with target bulk density (target bulk density is obtained from the GM for the HgM008 model) [no unit]
15: ratio of the crust+mantle polar moment and entire polar moment, Cm/C [no unit]
16: k2 (either counted as a measurement in MCMC, or predicted) [no unit]
Derived values:
17: average inner core density [kg/m3]
18: average outer core density [kg/m3]
19: average core densit [kg/m3]
20: vertical displacement Love number h2
21: horizontal displacement Love number l2
22: pressure at the center of the planet [Pa]
23: temperature of the inner core [K]
We present results for the following cases:
1: using data from G19, k2 as a measurement (mcmc_ag_meas.out)
2: using data from G19, k2 predicted (mcmc_ag_predict.out)
3: using data from M14, k2 as a measurement (mcmc_em_meas.out)
4: using data from M14, k2 predicted (mcmc_em_predict.out)
5: using data from G19, k2 predicted, larger range for CMB temperature (mcmc_ag_tcb_range.out)
6: using data from G19, k2 as a measurement, weight fractions inner and outer core different and unlimited (mcmc_ag_fdiff_free.out)
7: using data from G19, k2 as a measurement , weight fractions inner and outer core different but limited to a difference of at most 3%, with the outer core fraction > the inner core fraction (mcmc_ag_fdiff_fixed.out)
8: using data from G19, k2 as a measurement, where we assume the mantle has a constant temperature (mcmc_ag_mantleconv.out)
9: using data from Konopliv et al., 2020 (K20), for the case of their “high” MoI value, using k2 as a measurement (mcmc_ak_high_meas.out)
10: using data from Konopliv et al., 2020 (K20), for the case of their “low” MoI value, using k2 as a measurement (mcmc_ak_low_meas.out)
11: using data from Konopliv et al., 2020 (K20), for the case of their “high” MoI value, k2 predicted (mcmc_ak_high_predict.out)
12: using data from Konopliv et al., 2020 (K20), for the case of their “low” MoI value, k2 predicted (mcmc_ak_low_predict.out)
13: using data from B21, k2 predicted (mcmc_sb_predict.out)
14: using data from Hauck et al., 2013, k2 predicted (mcmc_sh_predict.out)
These results can be used to investigate dependencies between parameters (as shown in an example in Figure 2), or to investigate the effect on parameter distributions of additional down-selections.
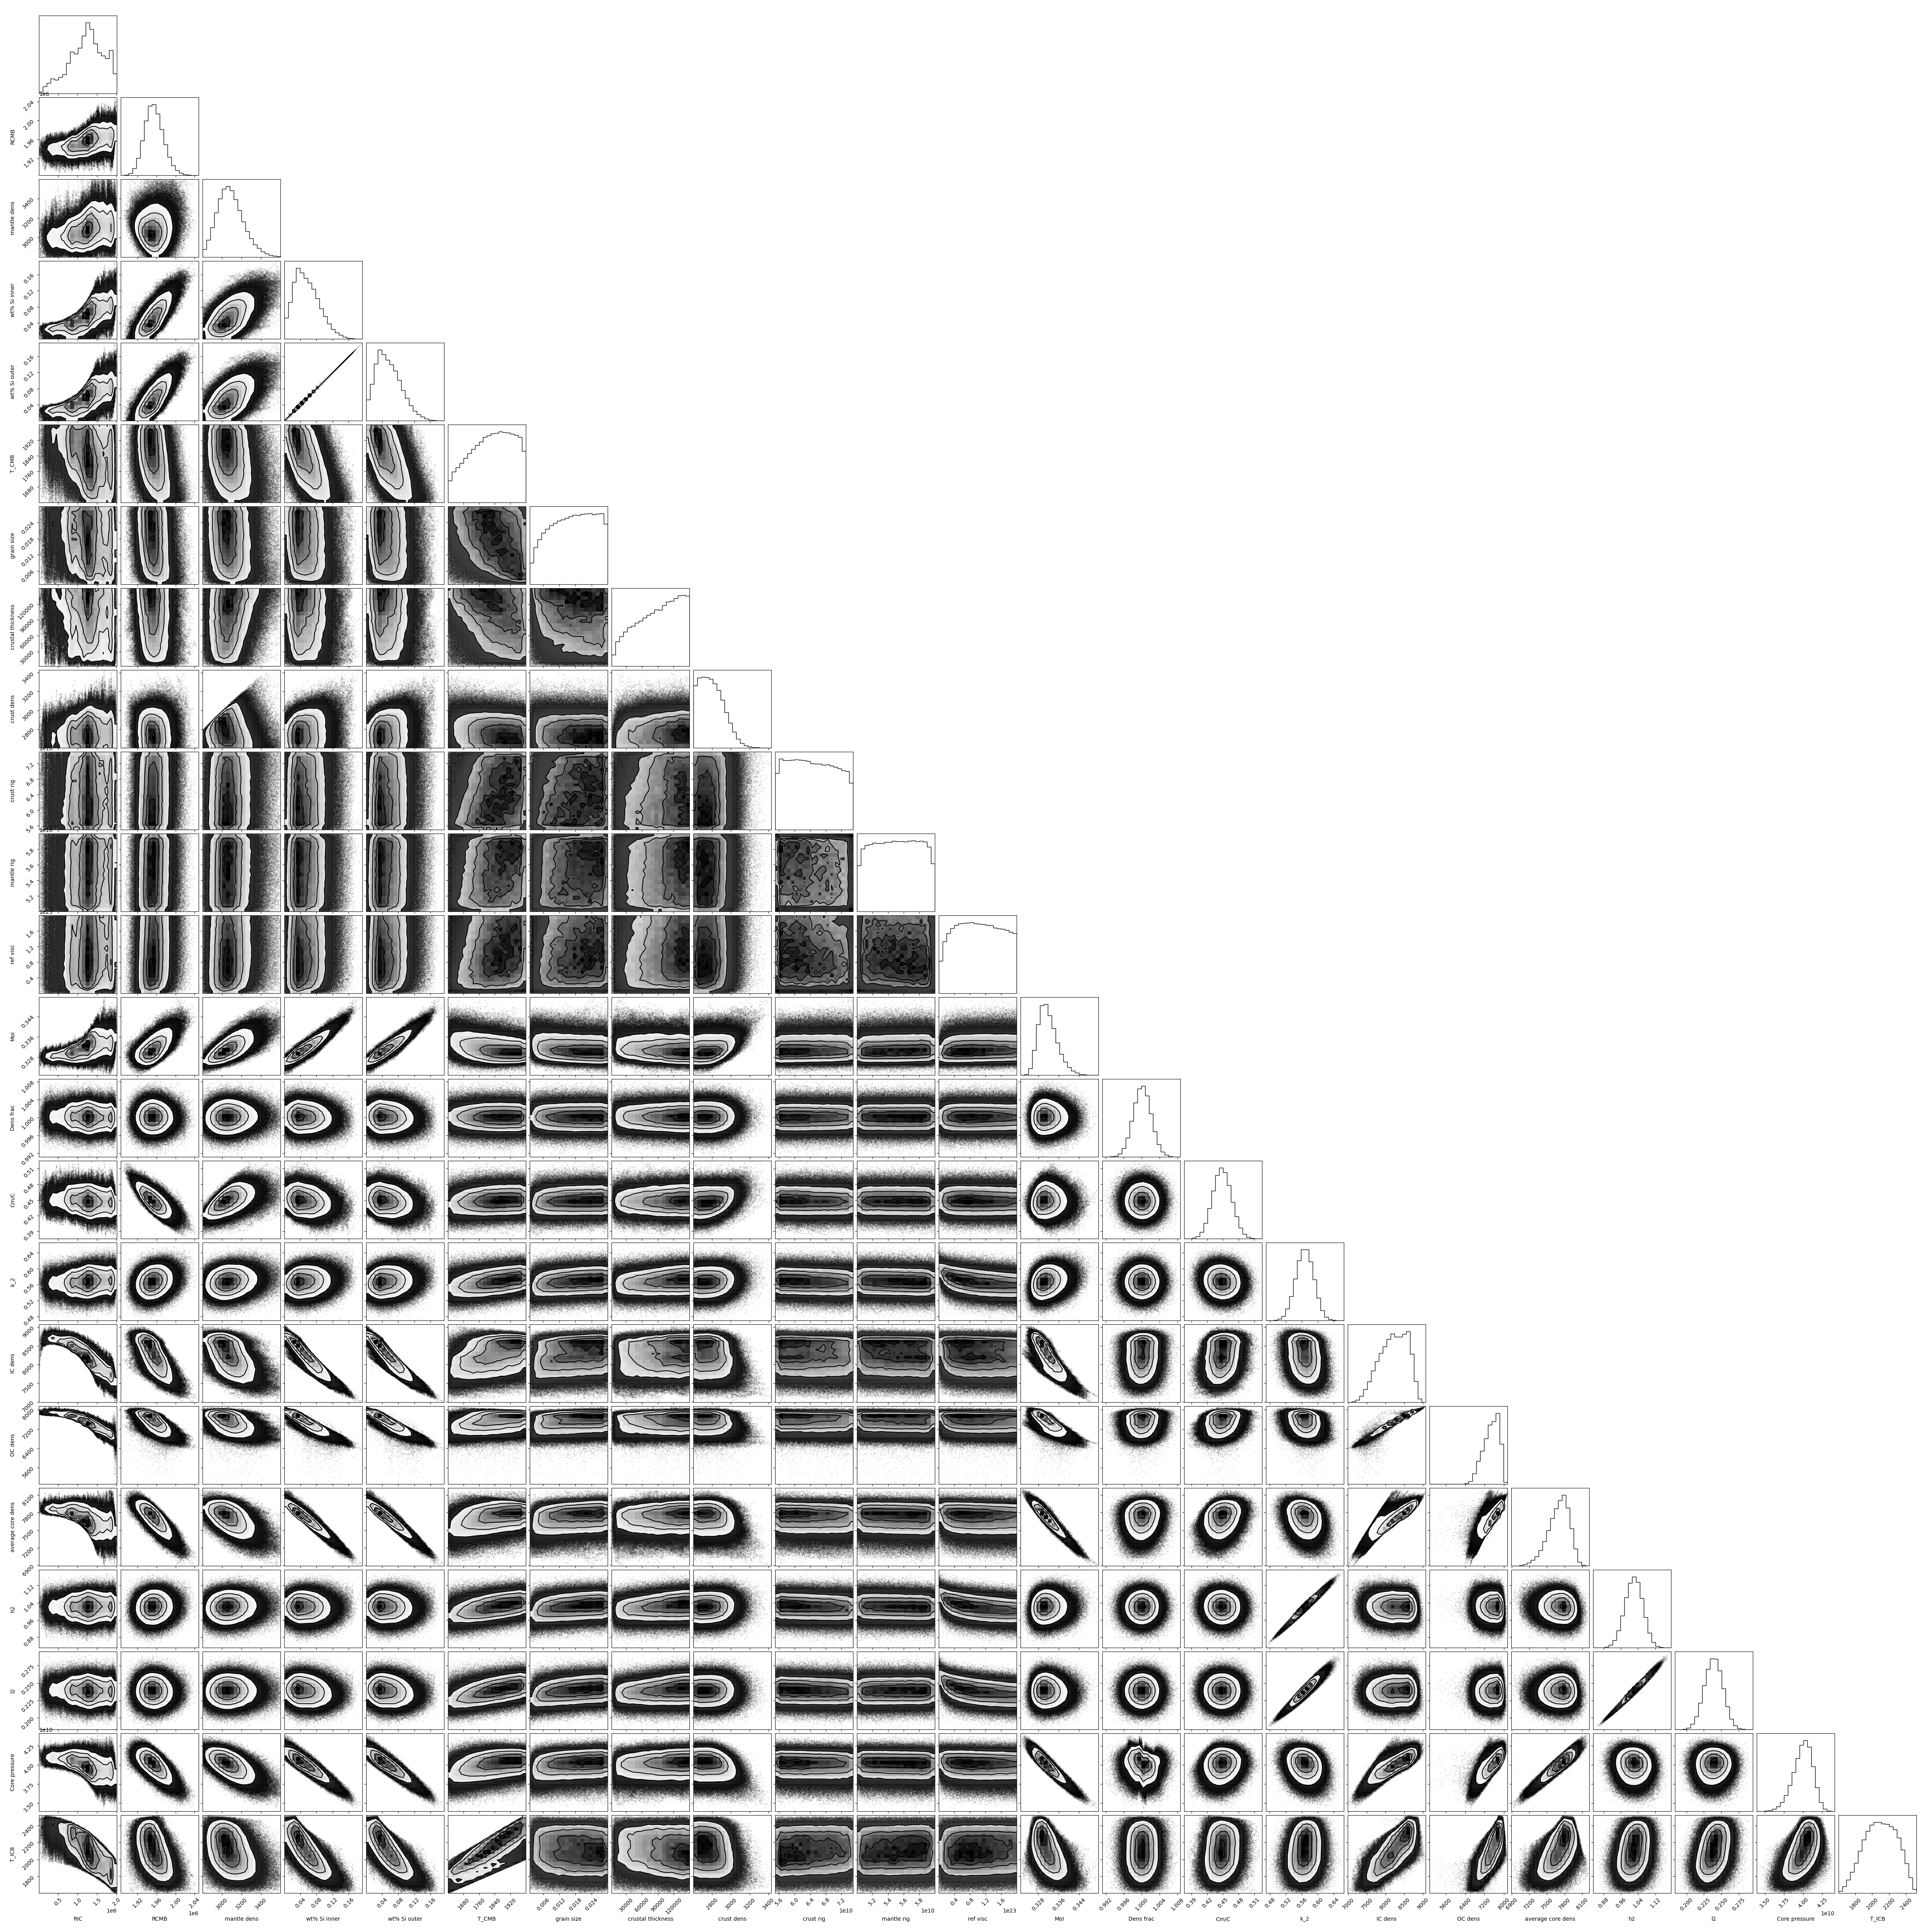
Figure 2. Dependencies between parameters when using data from G19, k2 as a measurement. Generated by the Python package “corner”. Click on image to download ~8MB PNG. Click here to download ~40MB PNG.
Data Usage Policy
Please cite the following reference when using any of these products:
Goossens et al., 2022, Planet. Sci. J. 3 37, doi:10.3847/PSJ/ac4bb8.
References
Bertone et al., 2021, J. Geophys. Res. Planets, doi:10.1029/2020JE006683.
Genova et al., 2019, Geophys. Res. Lett., doi:10.1029/2018GL081135.
Hauck et al., 2013, J. Geophys. Res. Planets, doi:10.1002/jgre.20091.
Konopliv et al., 2020, Icarus, doi:10.1016/j.icarus.2019.07.020.
Margot et al., 2012, J. Geophys. Res. Planets, doi:10.1029/2012JE004161.
Mazarico et al., 2014, J. Geophys. Res. Planets, doi:10.1002/2014JE004675.
Stark et al., 2015, Geophys. Res. Lett., doi:10.1002/2015GL065152.
Steinbrügge et al., 2021, Geophys. Res. Lett., doi:10.1029/2020GL089895.