Mercury South Polar Topography
Stefano Bertone
Mercury's South Polar region is of particular interest since Arecibo radar measurements show many high-reflectance regions consistent with surface or near-surface ice deposits (Harmon et al., 2011; Chabot et al., 2018). Detailed modeling of the illumination and thermal conditions at these radar-bright locations would allow the first constraints on the volatiles potentially residing there. However, because of MESSENGER's (Solomon et al., 2008) very elliptical orbit, no laser altimetry is available at Southern latitudes and previous terrain models based on camera data (Becker et al, 2016) had insufficient resolution for detailed analysis similar to what has been possible near the North Pole (Paige et al., 2013; Chabot et al., 2018; Gläser et al., 2022).
We thus produced a new higher-resolution topographic map of Mercury’s south polar region (75°-90° South, covering ~1.3 million km2) by using data collected by the NASA MESSENGER spacecraft's Mercury Dual Imaging System (MDIS; Hawkins et al., 2007) over the years 2011-2015. This new map enables, e.g., the first detailed modeling of illumination and thermal conditions in these southern radar-bright locations and the first constraints on the nature and history of volatiles residing there, but it is also intended as a resource for other geophysical analyses and for the preparation of the BepiColombo mission, currently en-route to the planet.
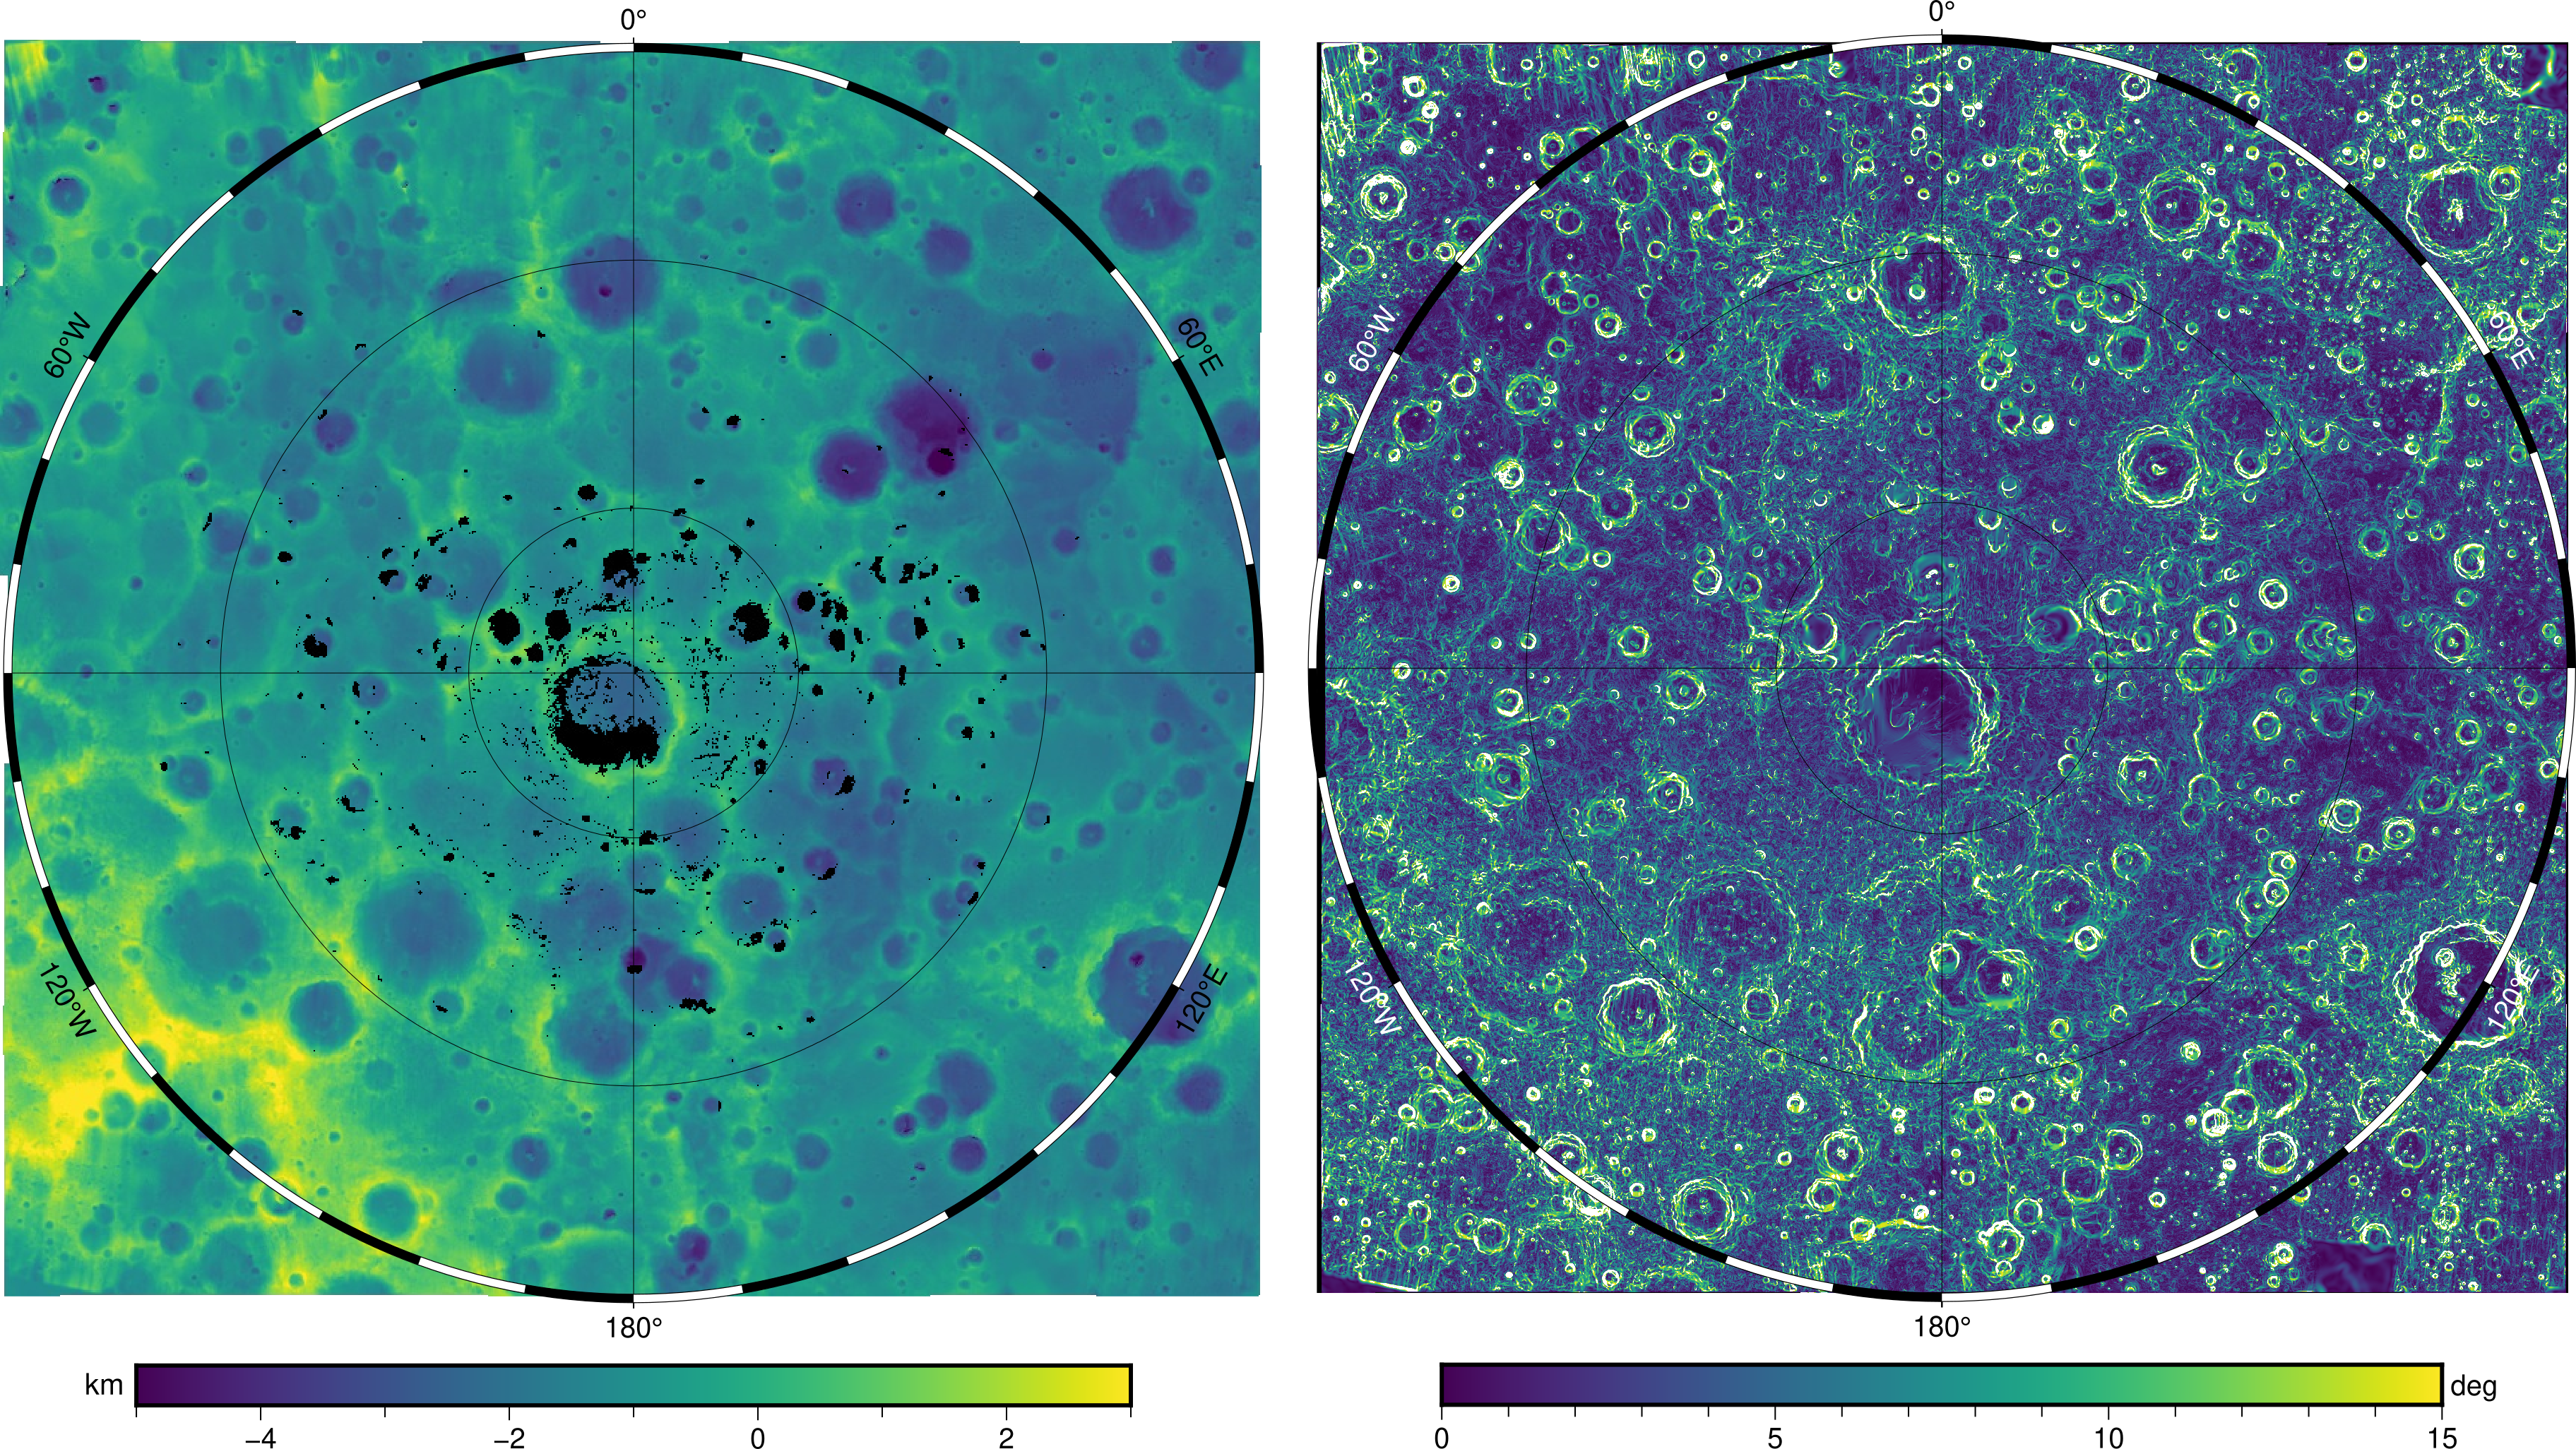
Figure 1. Our new 250 m/px SfS elevation model for Mercury's south pole region (left) with Permanently Shadowed Regions masked in black, and derived slopes (right) showing detailed features and smaller craters, which are key to determining reliable illumination and thermal conditions at the surface. Click on image for high-res PNG (11 MB).
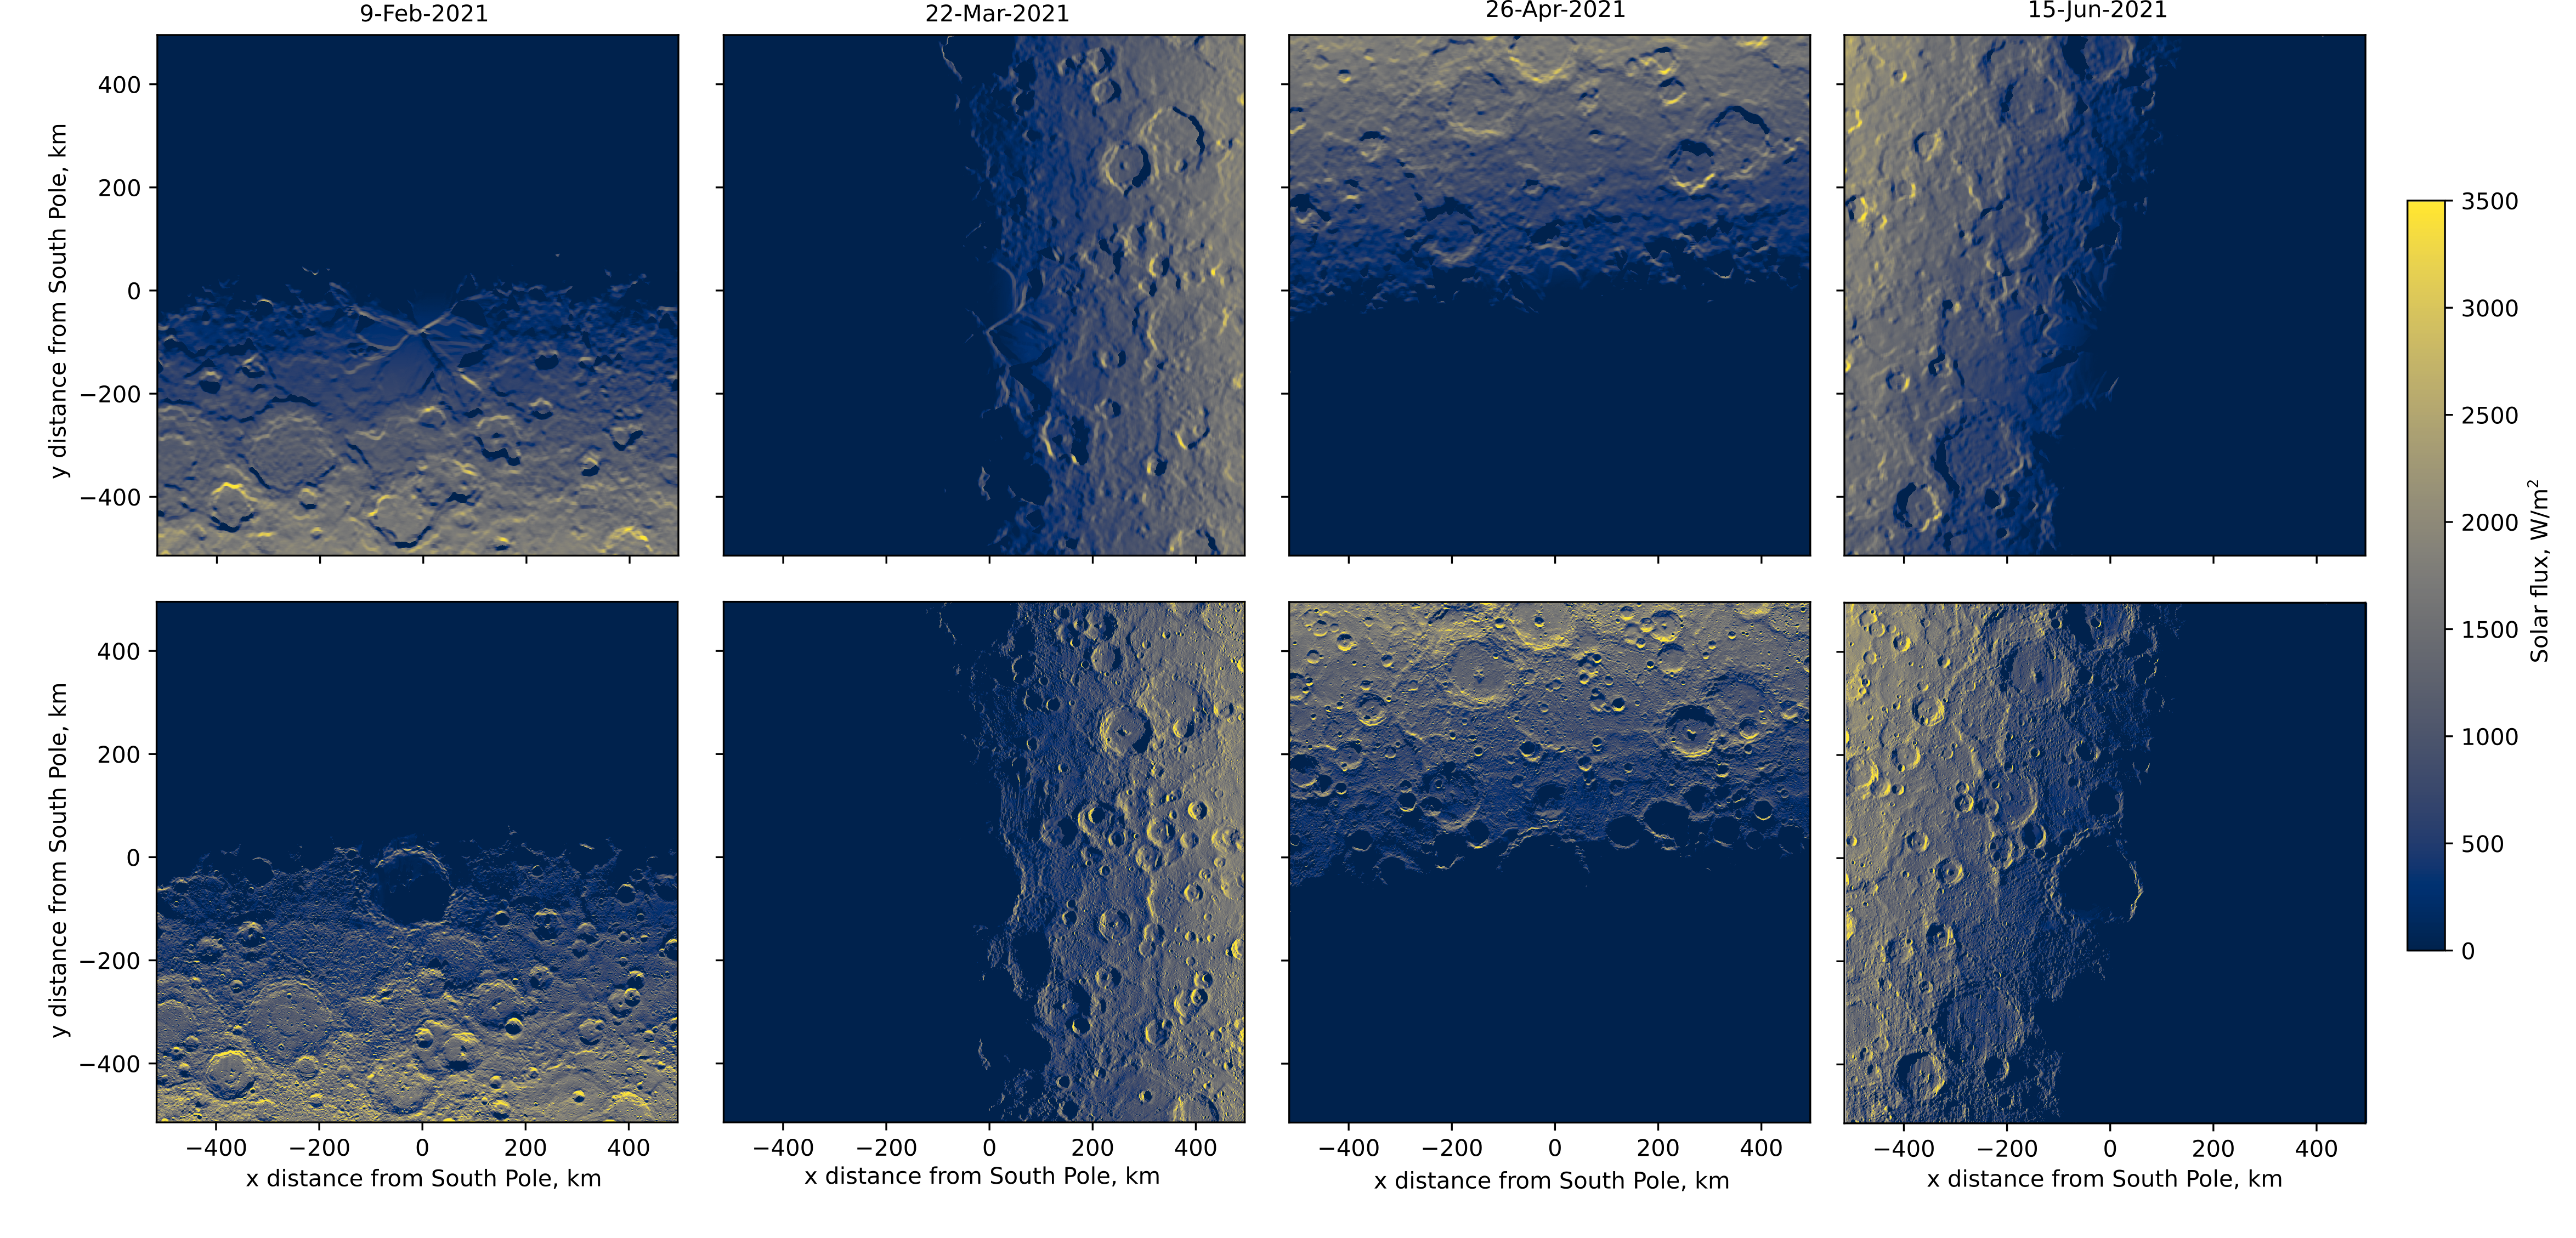
Figure 2. Rendering the USGS (top) and our DEM (bottom) with direct Sun illumination at noon of selected days covering a full Mercury solar cycle shows the increased level of detail of the recovered surface features and lack of large-scale artifacts when illuminating from any direction. Click on image for high-res PNG (6 MB).
Approach
In this study, we use an approach called photoclinometry (Horn et al, 1970), or Shape-from-Shading (SfS), to provide higher resolution topographic maps of the South Pole. In this method, the terrain slope is inferred from the shading variations in images caused by variations in illumination and observation geometry, and topography is obtained from the reconstructed slopes. SfS works best when multiple images per scene are available, sampling a wide range of solar azimuths.
In our analysis, we first select among the >2.7×10⁵ geolocated MDIS images available on the PDS for the whole planet, NAC images with a pixel scale better than 250 m/px, off-nadir angle <45°, incidence angle <85° (i.e., taken on the day-side of Mercury), a >2% overlap with the latitudes of interest. As using all images satisfying the above criteria would not be computationally practical, we use a custom Python tool to select a reduced set of images ensuring optimal surface coverage and Sun azimuth range at each surface point below 75° South. We tile the whole area of interest in 25 overlapping square tiles ~200 km on a side (in stereographic projection) and we select 15-20 images per tile for SfS.
We then use the NASA Ames Stereo Pipeline (ASP, Alexandrov & Beyer, 2018) to build elevation models with a pixel scale of 250 m/pix (the size of the minimum resolvable terrain feature is ~500-700 meters, corresponding to 2-3x the pixels size). We carefully align the resulting surface tiles with a bundle adjustment before building up a seamless mosaic using ASP's suite of tools.
Both visual validations and comparisons against Becker et al (2016) do not reveal any evident craters misalignment or broad-scale elevation discrepancies. However, we note that our DEM is only reliable outside of PSRs, so that despite overall major improvements, residual slope and illumination artifacts can still be found in the PSRs and in the adjacent regions. Residual "striping" can also be sometimes visible outside of PSRs and under specific illumination conditions. Finally, the Chao Meng-Fu crater (87.3°S, 132.4°W) required additional manual processing due to the minimal illumination available in (mostly long exposure) NAC images and non-existent a priori elevation information.
Data Products
Given that no MLA measurements are available to recover terrain elevation in shadowed south polar areas, we produced two versions of our improved terrain maps: one where PSRs are simply interpolated by sfs from the neighboring terrain, and another one where we assume a nearly axisymmetric radial profile for well-defined craters in order to fill in their PSRs with information from their sunlit portions. While the latter interpolation strategy is in a way "more realistic", processing artifacts are sometimes introduced in both maps. Each user should assess which product best fits their needs, while keeping in mind that any of the topography derived or interpolated for PSRs (e.g., based on the surrounding sunlit topography or enforced to fit prior knowledge) is not directly observed by MDIS. To identify (and eventually exclude) these less robust regions, we also distribute here a mask covering all areas of the map with no available data.
- DEM (interpolated): GeoTIFF COG (125 MB)
- DEM (filled): GeoTIFF COG (128 MB)
- Slopes derived from DEM: GeoTIFF COG (156 MB)
- Mask (no image data available): GeoTIFF COG (<1 MB)
- Difference vs. USGS: GeoTIFF COG (149 MB)
All these files are 250 m/pix GeoTiffs in south polar stereographic projection, with the X/Y coordinates in meters. They have pyramidal overviews, in the Cloud-Optimized GeoTiff (COG) standard.
They were updated in April 2026 to fix inconsistencies in the GeoTiff metadata.
Data Usage Policy
Please cite the following reference when using any of the products described above:Bertone, S., E. Mazarico, M.K. Barker, M. Siegler, J. M. Martinez Camacho, C. Hamill, A. Glatzenberg, N. L. Chabot (2022), Highly resolved topography and illumination at Mercury south pole from MESSENGER MDIS-NAC, accepted by The Planetary Science Journal, December 2022, doi:10.3847/PSJ/acaddb.
These data products are also archived on zenodo.org:
Bertone, S. (2023), Mercury South Pole Topography, zenodo.org/record/7542688.
Other references
Alexandrov, O., Beyer, R.A., 2018. Multiview shape-from-shading for planetary images, Earth and Space Science, 5, 652–666, doi:10.1029/2018ea000390.
Becker, K.J., Robinson, M.S., Becker, T.L., Weller, L.A., Edmundson, K.L., Neumann, G.A., Perry, M.E., Solomon, S.C. (2016), First Global Digital Elevation Model of Mercury, Lunar and Planetary Science Conference, p. 2959, PDF link.
Chabot, N.L., Shread, E.E., Harmon, J.K. (2018), Investigating Mercury's South Polar Deposits: Arecibo Radar Observations and High-Resolution Determination of Illumination Conditions, Journal of Geophysical Research (Planets), 123, 666–681, doi:10.1002/2017JE005500.
Gläser, P. (2022), Aspects of thermal modeling using digital terrain models, Astronomy & Astrophysics, A152, 664, doi:10.1051/0004-6361/202243812.
Harmon, John K. and Slade, Martin A. and Rice, Melissa S. (2011), Radar imagery of Mercury's putative polar ice: 1999-2005 Arecibo results, Icarus, 1, 37–50, 211, doi:10.1016/j.icarus.2010.08.007.
Hawkins, S.E., Boldt, J.D., Darlington, E.H., Espiritu, R., Gold, R.E., Gotwols, B., Grey, M.P., Hash, C.D., Hayes, J.R., Jaskulek, S.E., Kardian, C.J., Keller, M.R., Malaret, E.R., Murchie, S.L., Murphy, P.K., Peacock, K., Prockter, L.M., Reiter, R.A., Robinson, M.S., Schaefer, E.D., Shelton, R.G., Sterner, R.E., Taylor, H.W., Watters, T.R., Williams, B.D. (2007), The Mercury Dual Imaging System on the MESSENGER Spacecraft, Space Science Reviews, 131, 247–338, doi:10.1007/s11214-007-9266-3.
Horn, B.K. (1970), Shape From Shading: A Method For Obtaining The Shape Of A Smooth Opaque Object From One View, Technical Report, USA, PDF link.
Paige, D.A. et al. (2013), Thermal Stability of Volatiles in the North Polar Region of Mercury, Science 339, 300, doi:10.1126/science.1231106.
Solomon, S.C. et al. (2008), Return to Mercury: A Global Perspective on MESSENGER's First Mercury Flyby, Science, 321, 59, doi:10.1126/science.1159706.