Large-scale Lunar Elevation Models to Support Optical Navigation
Stefano Bertone
As part of NASA's Game Changing Development LuNaMaps Project, our group is involved in producing shape models of the lunar surface to support NASA science and exploration activities at the south pole and beyond. This includes the need for medium resolution terrain models to support optical navigation along the approach trajectory towards a destination near the Lunar South Pole.
Global lunar topography is already available based on datasets from the Lunar Reconnaissance Orbiter (LRO) Lunar Orbiter Laser Altimeter (LOLA) and JAXA’s Kaguya Terrain Camera with a resolution of 60 m/pix [SLDEM2015, Barker et al, 2016], and high resolution topographic maps are available polewards of 80°S (5 - 30 m/pix, see Barker et al., 2023, https://pgda.gsfc.nasa.gov/products/81 and https://pgda.gsfc.nasa.gov/products/90) and especially at specific regions of interest (5 m/pix from LOLA, Barker et al., 2021, https://pgda.gsfc.nasa.gov/products/78; and 1 m/pix under development based on LRO Camera [LROC] Narrow Angle Camera [NAC]). However, such available products do not cover the needs for optical navigation approaching the lunar south pole, where on-board camera resolution and a relatively low altitude would support navigation when provided with elevation models with resolutions of 30 m/pix along the narrow (tens of km wide) landing path. In particular, at these latitudes and resolution, current LDEMs show wide interpolated, smooth spaces between subsequent LOLA tracks, where no detailed elevation information is available.
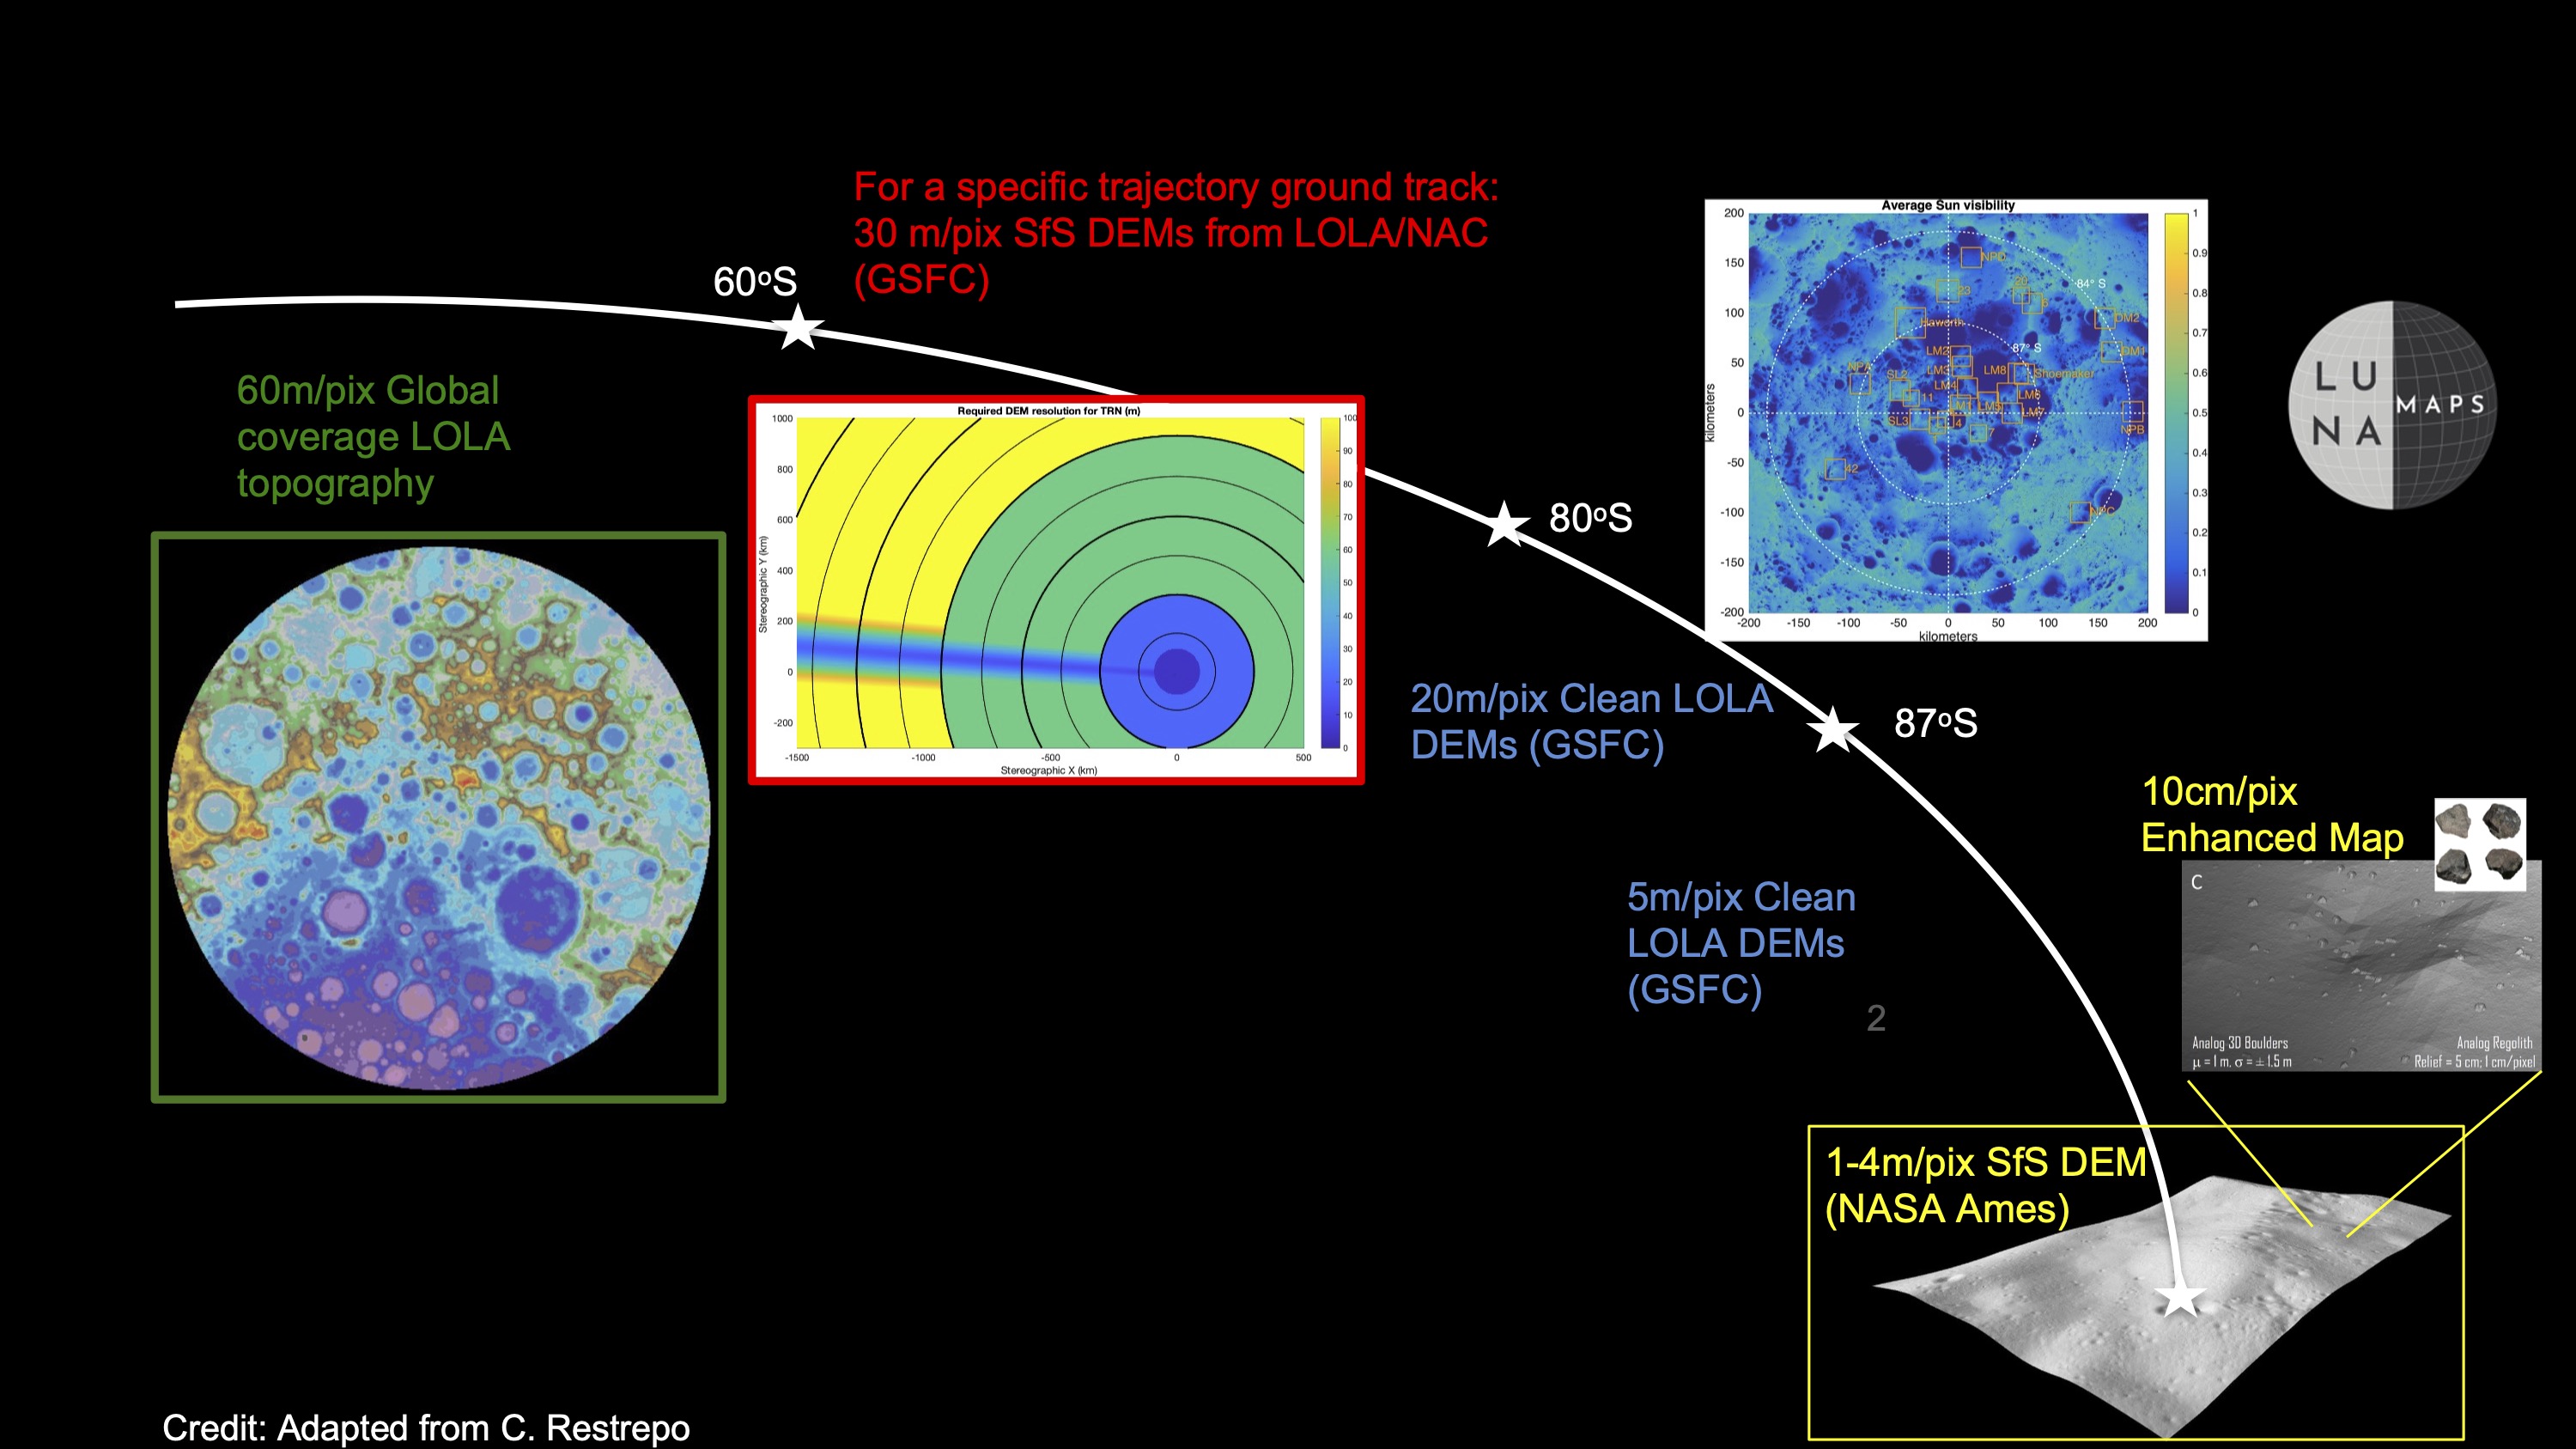
Figure 1. Multiple terrain topography products with increasing resolutions are required during approach to the lunar south pole. Our work bridges the gap between the global 60 m/pix SLDEM and higher resolution LOLA and LROC products only available polewards of 80°-87°S.
In order to cover this "gap", we used a technique known as Shape-from-Shading (SfS), implemented within the available Ames Stereo Pipeline (ASP) software package [Alexandrov and Beyer, 2018]. We processed images of the lunar surface taken by the LROC camera to refine existing altimeter-based topographic maps into more accurate terrain maps for a potential approach path. Because it is a computationally demanding task, SfS has thus far mostly been used to retrieve high-resolution (0.5-2 meters/pixel) terrain models of sites with a limited area [e.g., Alexandrov, 2018]. Our application is in this sense very unusual: we target medium-resolution (~30 m/pix) terrain models over a 18,000 km2 strip between 60°-80°S.
We still base our work on high resolution (0.5-2 meters/pixel) images captured by the LROC NAC, by downsampling such images to our target resolution of ~30 m/pix. At this resolution, given the large size of our Region of Interest (RoI) SfS is still computationally demanding. Therefore, we leveraged our past experience at Mercury [Bertone et al., 2023] to split the problem and to make it compatible with the computational resources available at the NASA Center for Climate Simulations. We developed a sophisticated semi-automated pipeline (see Fig. 2) embedding both ASP and ISIS image processing tools, as well as relevant python libraries.
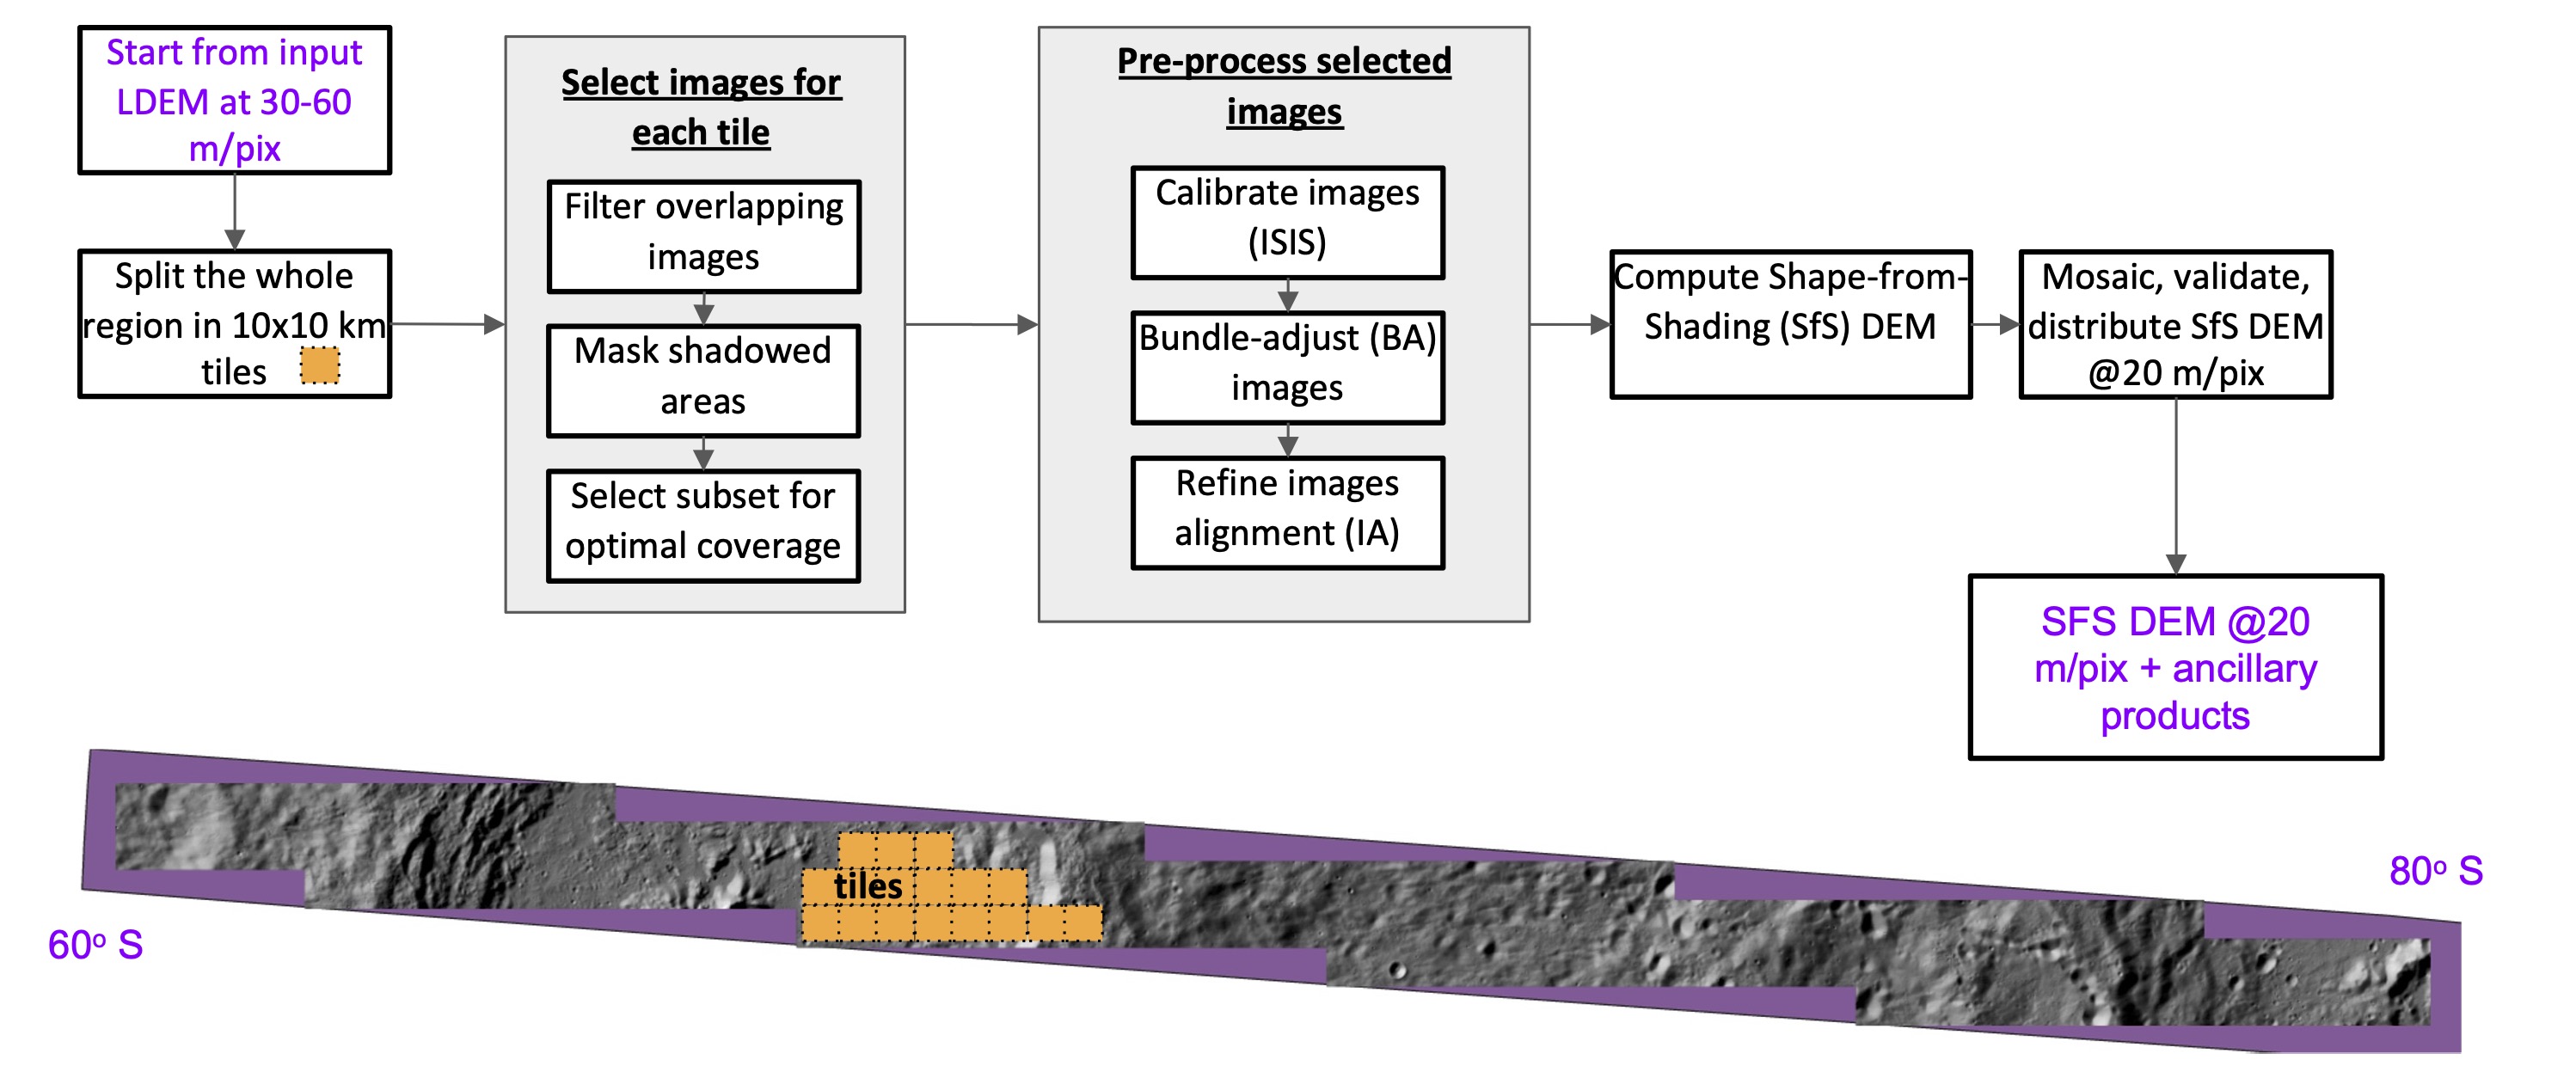
Figure 2. From top-left to bottom-right, the steps of our pipeline from the input, LOLA based, lunar DEM (LDEM) to the selection, calibration, and alignment of the LROC NAC images used for the computation and validation of our SfS DEMs.
Approach
In this study, we use an approach called photoclinometry (Horn et al.,, 1970), or Shape-from-Shading (SfS), to provide higher resolution topographic maps of the South Pole (see Alexandrov & Beyer and references therein). In this method, the terrain slope is inferred from the shading variations in images caused by variations in illumination and observation geometry, and topography is obtained from the reconstructed slopes. SfS works best when multiple images per scene are available, sampling a wide range of solar azimuths.The first step in our analysis is to select an optimal subset of NAC images among the more than 3 million available, given their ground location, their resolution, and their geometrical properties. The large ROIs, such as the long approach path, was then discretized into square, overlapping tiles with a size of 10 km x 10 km. We leverage Python geometry, georeferencing, and ML libraries to select a limited dataset (~30 images) for each tile, maximizing the tile geographical coverage with images having a wide range of illumination directions.
The second step consists of carefully aligning these images between each other and to an available reference terrain model, in order to correct for imperfections in the prior knowledge of LRO's position and attitude. Then, based on the resulting images, the ASP SfS tool provides an accurate mapping of terrain elevation at the target resolution. We then check the results for artifacts or defects, and eventually iterate the procedure with a different selection of images.
Finally, using additional ASP tools and custom scripts, we merge the reconstructed terrain tiles in a seamless mosaic covering the ROI, e.g., the full approach path or a high-resolution landing site candidate. Overlapping regions are used for a final validation of the results and errors assessment before delivering the terrain maps.
Caveats
This code is distributed as-is, meaning it is not guaranteed to work on other systems and in other use-cases, and it will not work without significant expert user guidance and manual intervention. It is not intended to be used operationally nor will it be updated on a regular basis.Products
We distribute our maps both as a single mosaic of our collection of "tiles". Each tile has an accompanying set of verification products, including: hillshades, elevation differences vs LDEM, x-y disparity maps vs LDEM, elevation differences at overlaps between tiles.LDEM (mosaic, hillshade)
SfS DEM (mosaic, hillshade)
Elevation differences to LDEM
Disparity maps to LDEM
Elevation differences at overlaps between tiles
Download the TAR archive here (1.1 GB).
All these files are 30 m/pix GeoTiffs with south polar stereographic X/Y coords in meters.
Our code is available on Zenodo.
If using these products, please cite:
Bertone S., Barker M. K., Mazarico E., 2023. Large-scale elevation models to support optical navigation to the Lunar surface. doi:10.5281/zenodo.10258683
References
Alexandrov, O., Beyer, R.A., 2018. Multiview shape-from-shading for planetary images. Earth and Space Science 5, 652–666, doi:10.1029/2018ea000390Barker, M.K. et al., 2016. A new lunar digital elevation model from the lunar orbiter laser altimeter and SELENE terrain camera, Icarus, 273, pp. 346-355, doi:10.1016/j.icarus.2015.07.039
Barker et al., 2021, "Improved LOLA Elevation Maps for South Pole Landing Sites: Error Estimates and Their Impact on Illumination Conditions", Planetary & Space Science, Volume 203, 1 September 2021, 105119, doi:10.1016/j.pss.2020.105119
Barker et al., 2023 “A New View of the Lunar South Pole from the Lunar Orbiter Laser Altimeter (LOLA)”, Planet. Sci. J., 4, 183. doi:10.3847/PSJ/acf3e1
Bertone, S., E. Mazarico, M.K. Barker, M. Siegler, J. M. Martinez Camacho, C. Hamill, A. Glatzenberg, N. L. Chabot (2022), Highly resolved topography and illumination at Mercury south pole from MESSENGER MDIS-NAC, Planet. Sci. J., 4, 2, December 2022, doi:10.3847/PSJ/acaddb
Horn, B.K., 1970. Shape From Shading: A Method For Obtaining The Shape Of A Smooth Opaque Object From One View. Technical Report. USA.