Enhanced Topography Models for Selected Lunar South Pole Regions with Shape-from-Shading
Stefano Bertone
We present 5 m/pix Shape-from-Shading digital elevation models (SDEMs) for the 13 original Artemis III Candidate Landing Regions announced in 2022. These products use LROC NAC images to enhance the effective resolution of the LOLA-based 5 m/pix south polar DEMs, adding terrain detail in illuminated areas while retaining consistency with the LOLA geodetic reference. They address a key limitation of existing LOLA-based products, whose effective resolution depends strongly on local LOLA track density and therefore includes smooth interpolated gaps between tracks. The resulting data set covers more than 4,500 km2 of reconstructed terrain and is designed as a set of large-area, well-validated regional products that support lunar science and exploration applications, including slope and roughness analysis, illumination studies, landing-site characterization, and planning of surface operations.
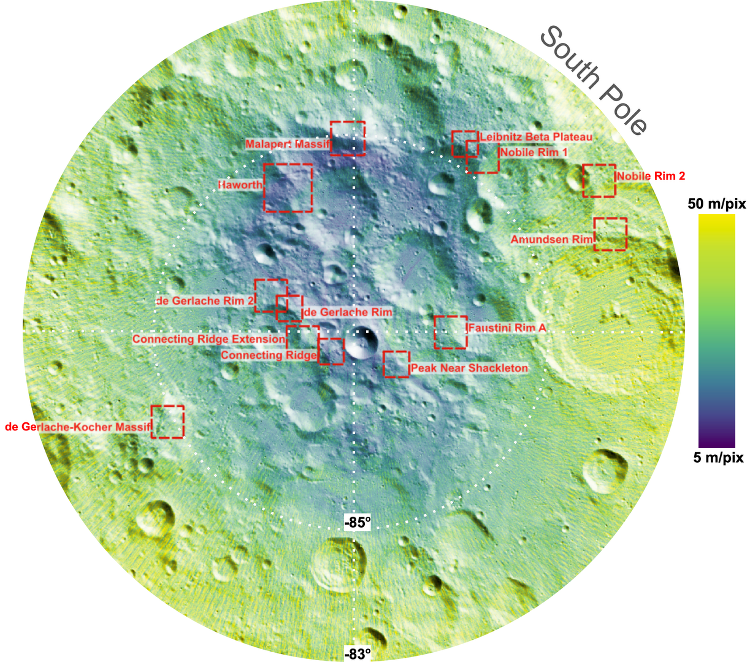
Figure 1. LOLA effective resolution in the south polar region surrounding the 13 original Artemis III candidate landing regions. The new SDEMs use LROC NAC images to enhance these scientifically and operationally important regions to a uniform 5 m/pix grid.
Processing Approach
We developed a semi-automated Python pipeline built around the Ames Stereo Pipeline (ASP), ISIS, and GDAL. See also this previous work. For each region, overlapping LROC NAC images are calibrated, map-projected to an a priori LOLA DEM, bundle-adjusted, filtered for quality, and then passed to ASP's Shape-from-Shading tools to generate the final 5 m/pix SDEM and ancillary products. A key part of the workflow is selecting a compact but effective subset of NAC images that preserves nearly full spatial coverage and at least three distinct illumination directions per pixel where possible. This reduces the computational burden while preserving the information needed for SfS. In many regions, only a small fraction of the initially available images is needed to support the final SDEM solution.
In this study, we use an approach called photoclinometry (Horn et al, 1970), or Shape-from-Shading (SfS), to provide higher resolution topographic maps of the South Pole. In this method, the terrain slope is inferred from the shading variations in images caused by variations in illumination and observation geometry, and topography is obtained from the reconstructed slopes. SfS works best when multiple images per scene are available, sampling a wide range of solar azimuths.
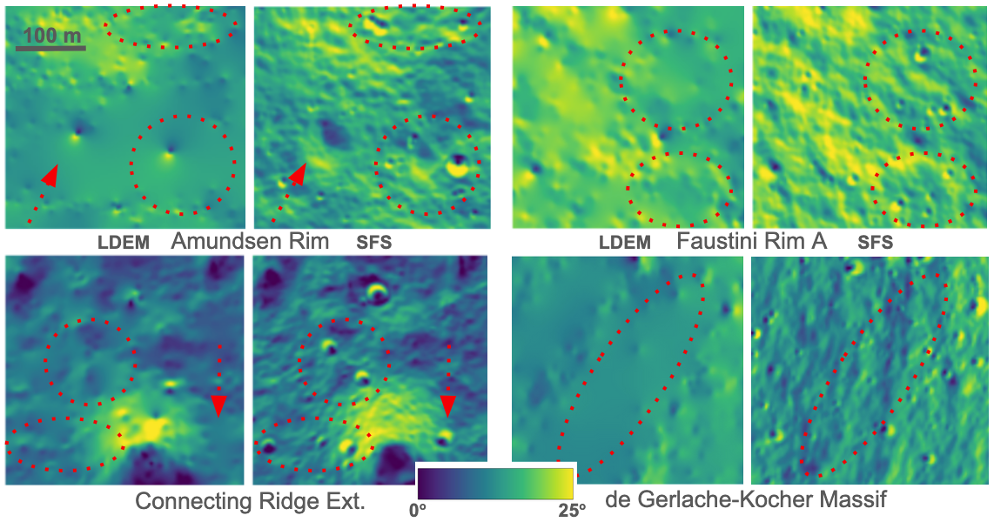
Figure 2. Close-up comparisons of LDEM and SDEM slope maps. The SDEMs resolve additional craters and short-scale terrain features in areas where the LDEM is limited by sparse LOLA sampling.
Products in the Archive
The Zenodo archive contains, for each of the 13 regions:- SDEM elevation raster;
- hillshade;
- maximum-illumination orthomosaic;
- image-coverage and solar-bin count maps;
- best-input-resolution map;
- SDEM minus LDEM difference map;
- slope maps at multiple baselines;
- VRM roughness maps at multiple baselines;
- ancillary files describing image selection and processing inputs.
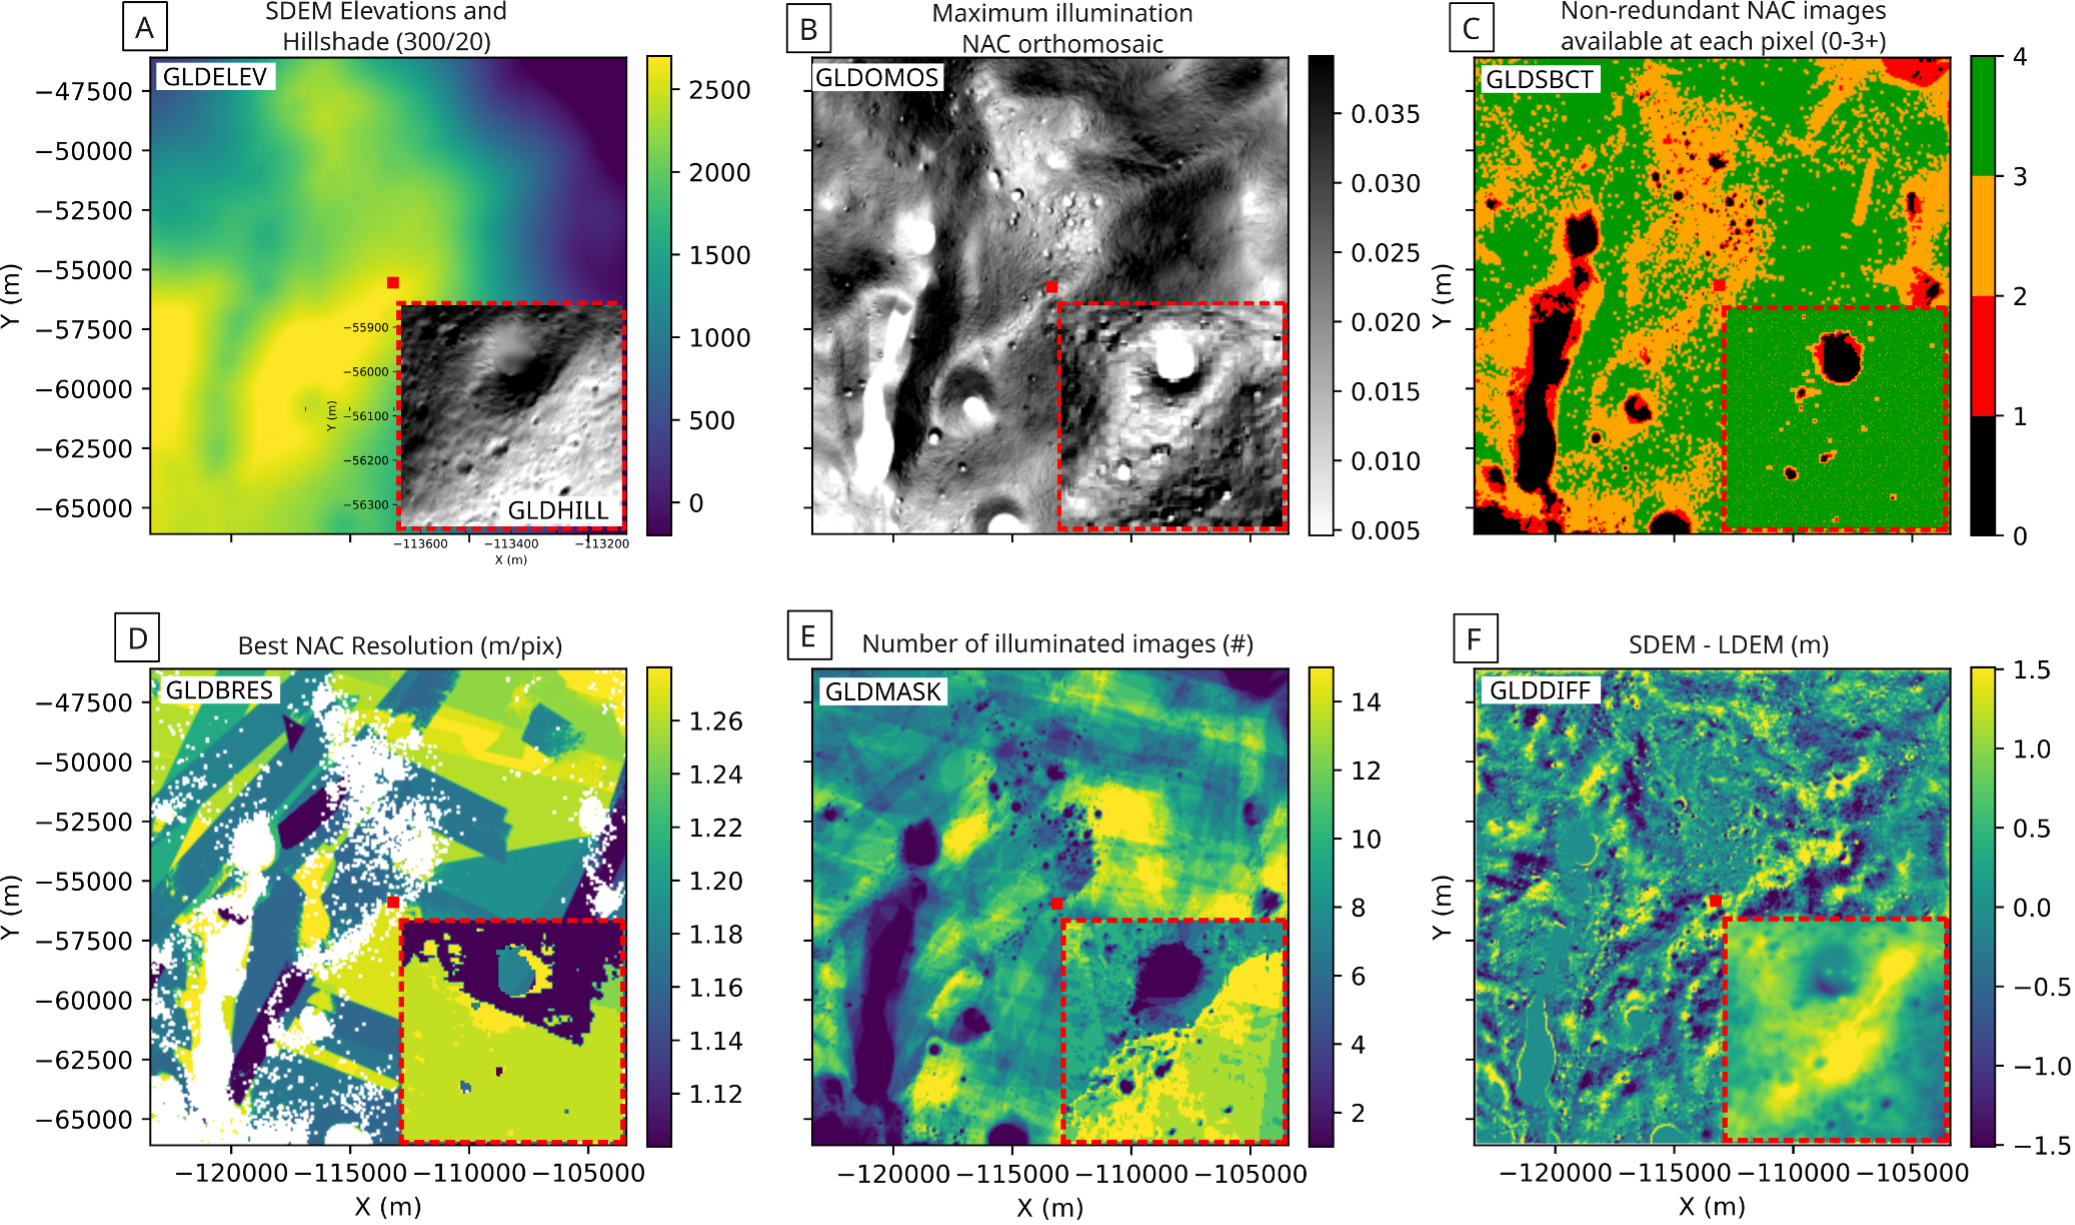
Figure 3. Example product suite for the De Gerlache–Kocher Massif region. Panels show the SDEM and hillshade, maximum-illumination orthomosaic, non-redundant image coverage, best input NAC resolution, number of illuminated images, and SDEM–LDEM elevation differences. The full archive contains analogous products for all 13 regions.
Data Availability
Full regional products and ancillary files are available from the Zenodo archive, doi: 10.5281/zenodo.17954508Data Usage Policy
Please cite the following reference when using any of the products described above:Bertone, S., McKenna, T. E., Barker, M. K., Mazarico, E., Beyer, R. A., and Petro, N., Enhanced Topography Models for selected Lunar South Pole regions with Shape-from-Shading, The Planetary Science Journal, doi:10.3847/PSJ/ae5b70.
These data products are also archived on zenodo.org:
Bertone, S., Barker, M., Mazarico, E., McKenna, T., and Petro, N., 2025, Archived geospatial products for manuscript “Enhanced Topography Models for selected Lunar South Pole regions with Shape-from-Shading”, Zenodo, doi:10.5281/zenodo.17954508.
References
Bertone, S., McKenna, T. E., Barker, M. K., Mazarico, E., Beyer, R. A., and Petro, N., Enhanced Topography Models for selected Lunar South Pole regions with Shape-from-Shading, The Planetary Science Journal, doi:10.3847/PSJ/ae5b70.
Bertone, S., Barker, M., Mazarico, E., McKenna, T., and Petro, N., 2025, Archived geospatial products for manuscript “Enhanced Topography Models for selected Lunar South Pole regions with Shape-from-Shading”, Zenodo, doi:10.5281/zenodo.17954508.
Barker, M. K., Mazarico, E., Neumann, G. A., et al., 2021, Planetary and Space Science, 203, 105119.
Barker, M., Mazarico, E., Neumann, G., et al., 2023, The Planetary Science Journal, 4, 183.
Alexandrov, O., and Beyer, R. A., 2018, Earth and Space Science, 5, 652.